As the story of COVID-19 was unfolding back in early 2020, demanding every moment of our attention, there was another historic health event involving a viral relative.
This unprecedented event strangely coincided with the Covid-19 crisis but did not register a blip in the media landscape.
The 2020 media season began with warnings that the coming flu season was destined to be one of the worst in history. Even the CDC/NIAID Grand Poobah himself, Anthony Fauci, predicted early on that the 2020 flu season would be one of the worst in decades.
Despite those early forecasts, reports of the predicted flu rampage became scarce to non-existent by early March.
At the same time, the CDC scaled back its comprehensive ‘Flu View’ Surveillance System, its flagship offering for 22 years and shifted their focus to another “Influenza Like Illness”(ILI), Covid-19.
While the world was riveted by this ‘novel’ killer virus, the time-honored seasonal virus known as ‘the flu’ dropped to historic lows and virtually disappeared from the CDC’s surveillance system.
Was this a coincidence that our long-standing friend ‘the flu’ exited the stage at precisely the moment Covid entered?
How did this disappearance happen in such abrupt fashion?
An analysis from the CDC’s Flu Surveillance report demonstrates the unnatural speed of this departure and how early in 2020 it occurred, dispelling the notion that masks or lockdowns played any role in this vanishing act.
A close reading of data sets, created from the CDC’s own surveillance reports, reveals inexplicable anomalies in the CDC’s ILI tracking system preceding the arrival of Covid-19 which, given the CDC’s history of data manipulation, certainly raises a few eyebrows and more questions.
A QUICK HISTORY
The CDC introduced its Weekly Flu Surveillance Reports 22 years ago during the 1999/2000 season. Those early reports analyzed scant amounts of data, providing only a limited quantity of detailed information. For unspecified reasons the CDC would bolster its Surveillance Reports in the 2007/2008 season.
In the 07/08 season the CDC reports doubled in length and offered significantly more detail in the US National Flu Surveillance data. What was once a mom and pop operation turned into a big box store with weekly reports mushrooming from a paltry 3 pages to 10-12 page reports replete with colorful graphs and regional information.
As the focus on flu data expanded, greater specificity characterized each report. The tables created below are an outcome of those reports. The entire dataset can be viewed at the CDC’s past weekly surveillance reports.
The detail and comprehensive coverage given to the seasonal flu would remain a cornerstone of the CDC’s overall mission and reportage until March/April 2020.
UNDERSTANDING THE TABLES
The eight tables below tracking weeks 5-14 over an 8 year period (2013-2020) originate from the CDC’s Flu Surveillance Yearly Report.
Weeks 5-14, charted from 2013-2019, parallel the the onset of the COVID 2020 crisis and also constitute the weeks in 2020 when the ‘flu’ faded from view.
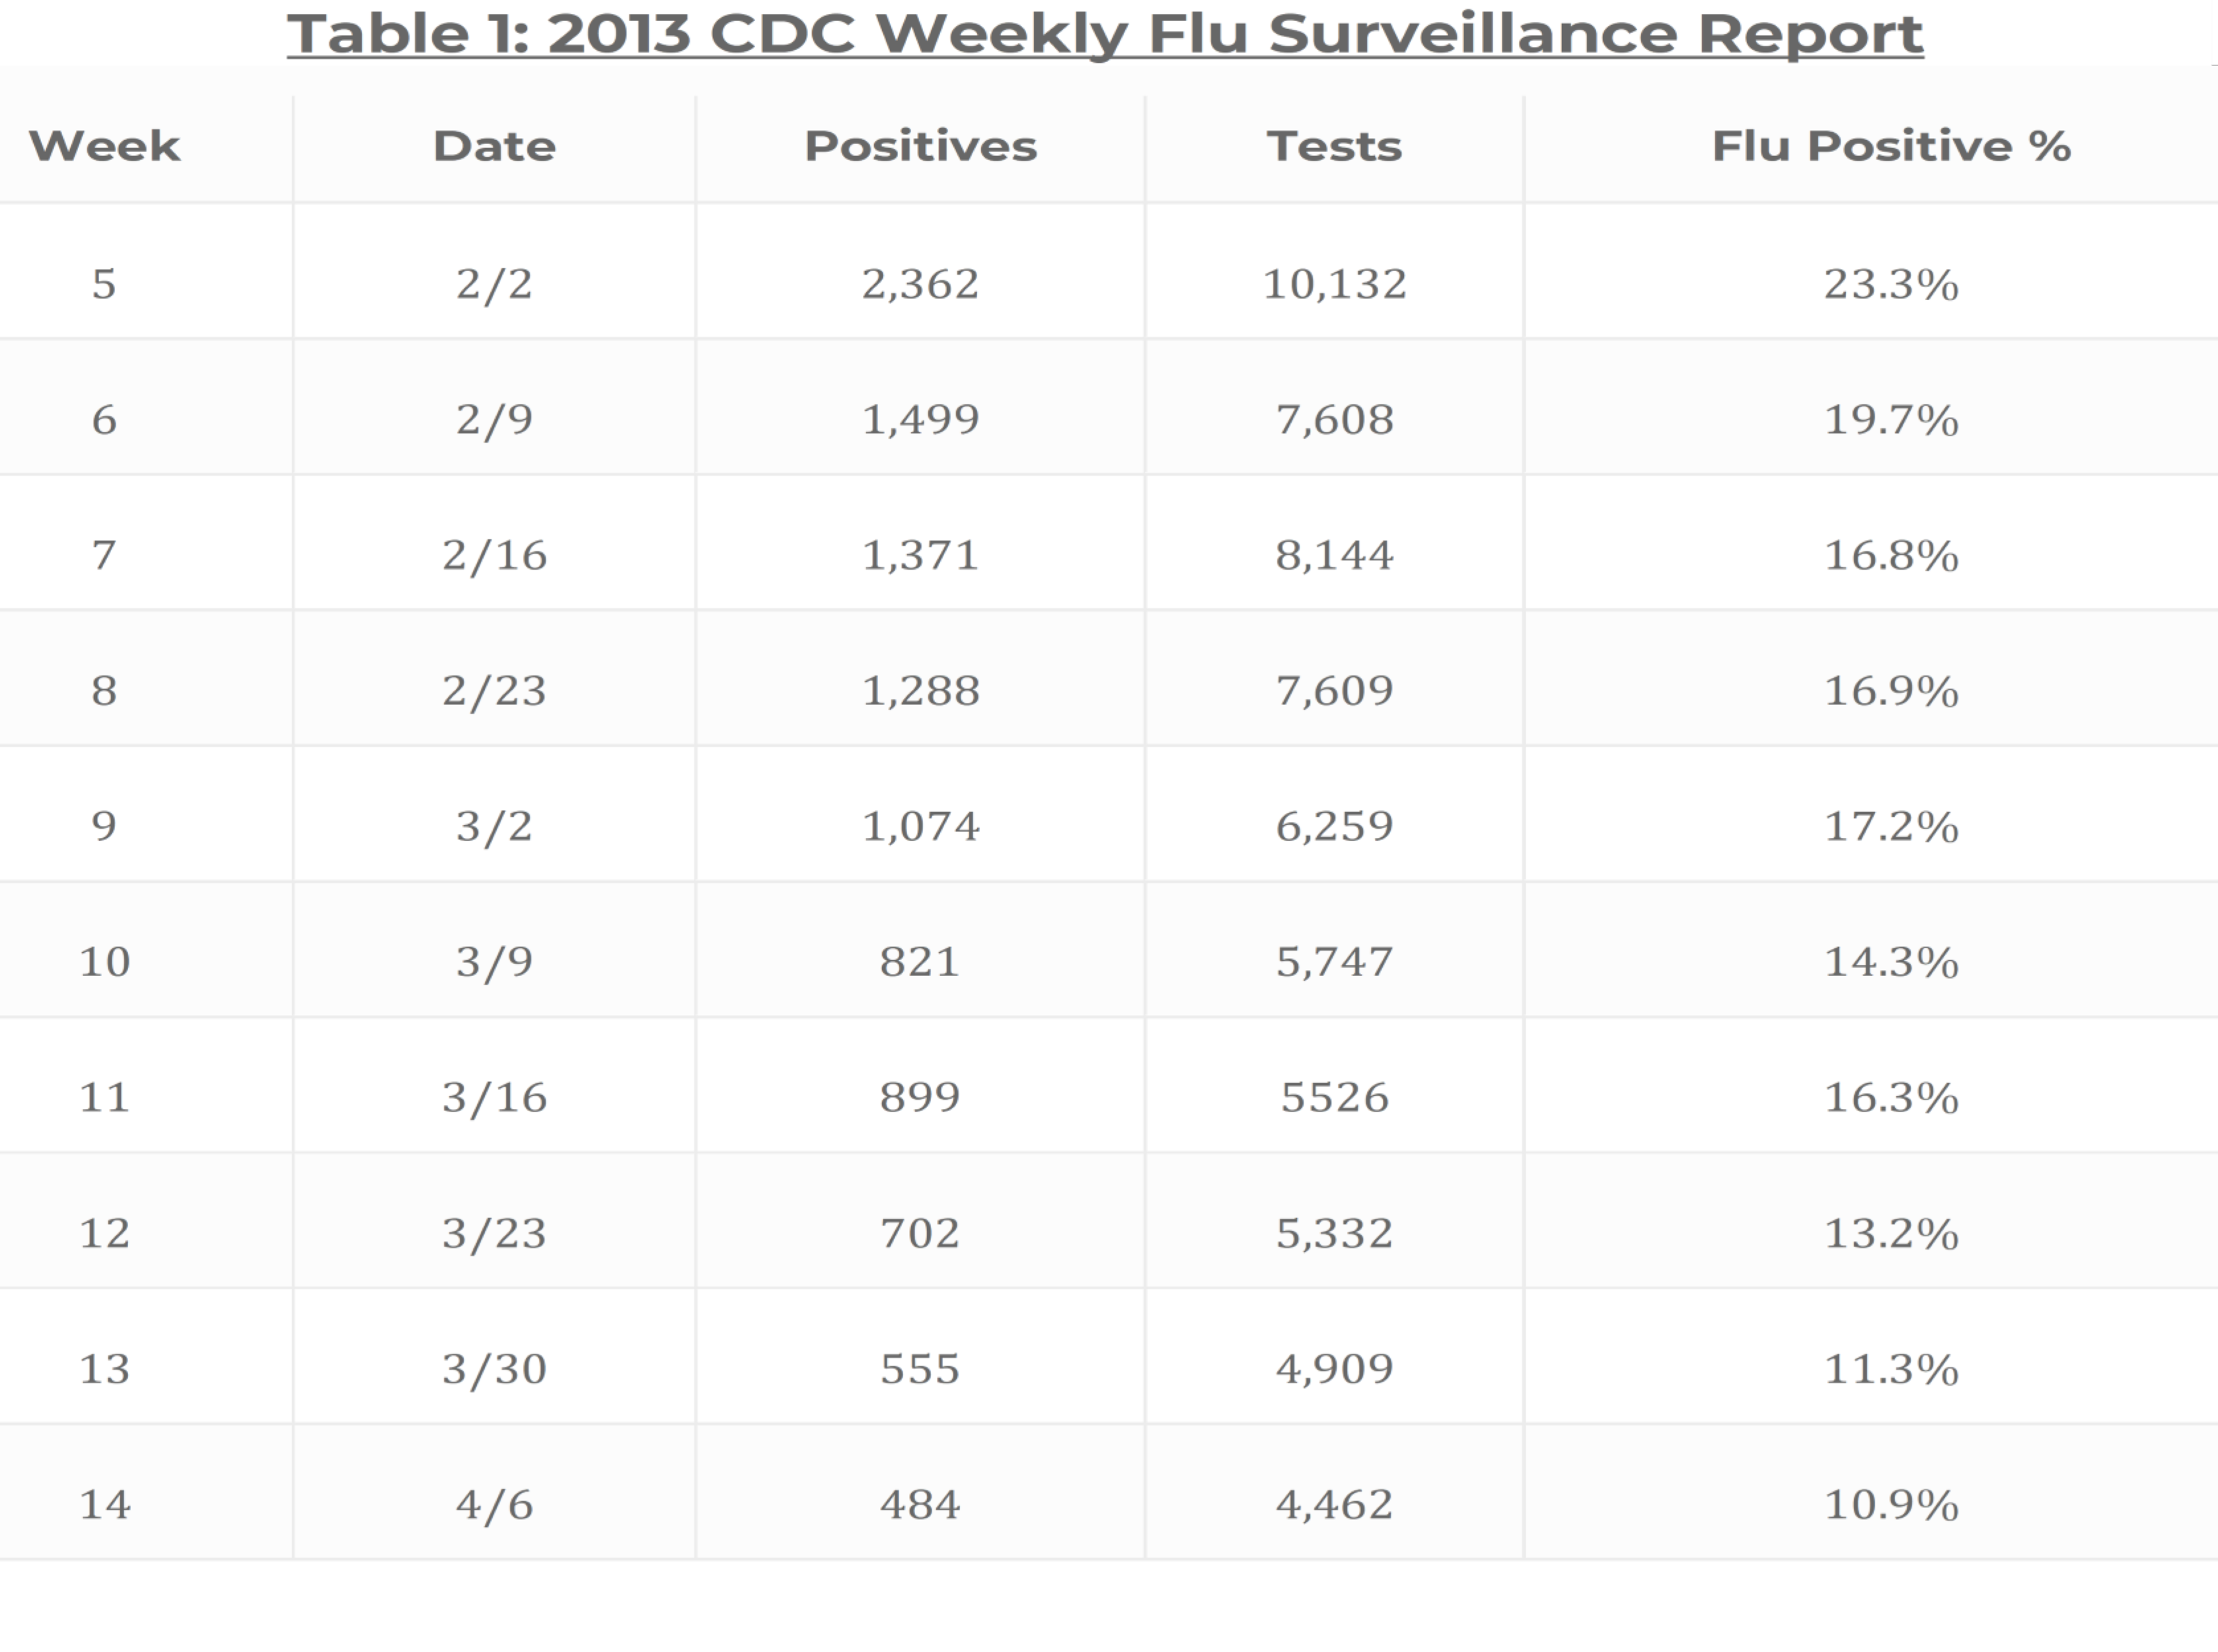
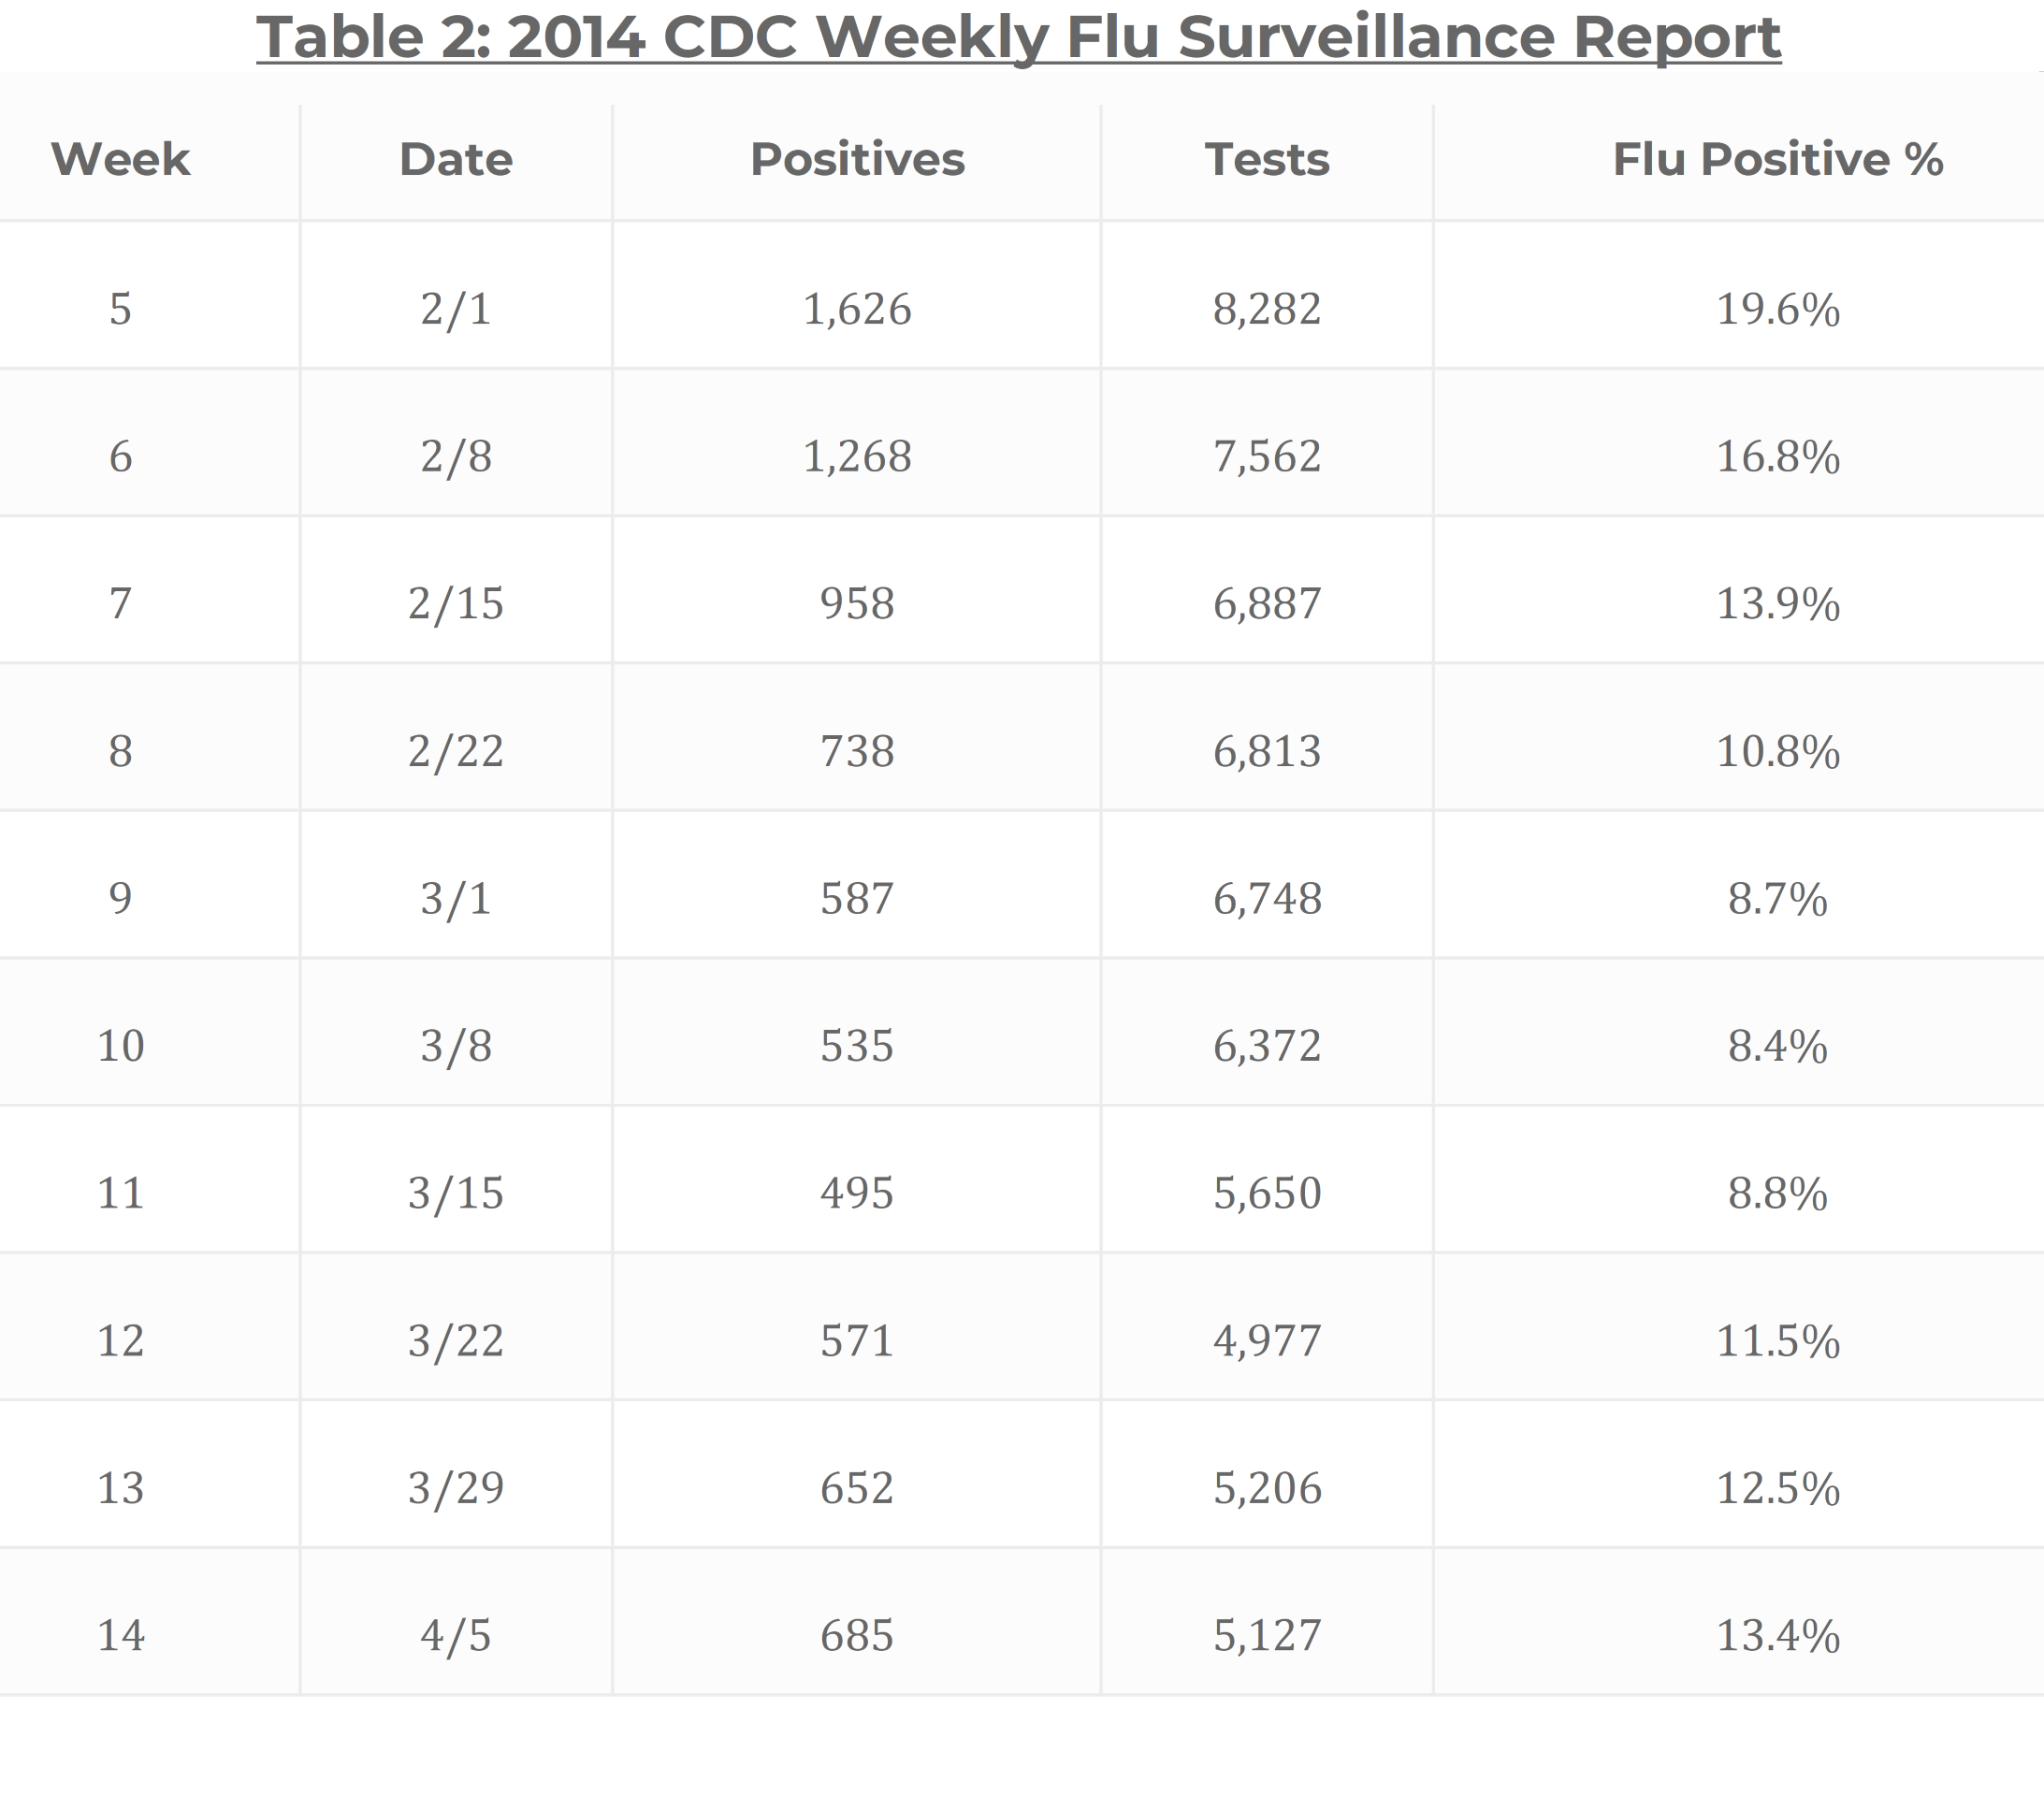
The first column on the left, seen below in Table 1 (2013) and Table 2 (2014), represent specific weeks and the date that week started.
The middle column illustrates the number of tests taken and the number of ‘positive’ results.
The column on the far right represents the percentage of ‘flu positives’ during that week. This final number, the flu positive percentage, is the most salient data point of this survey.
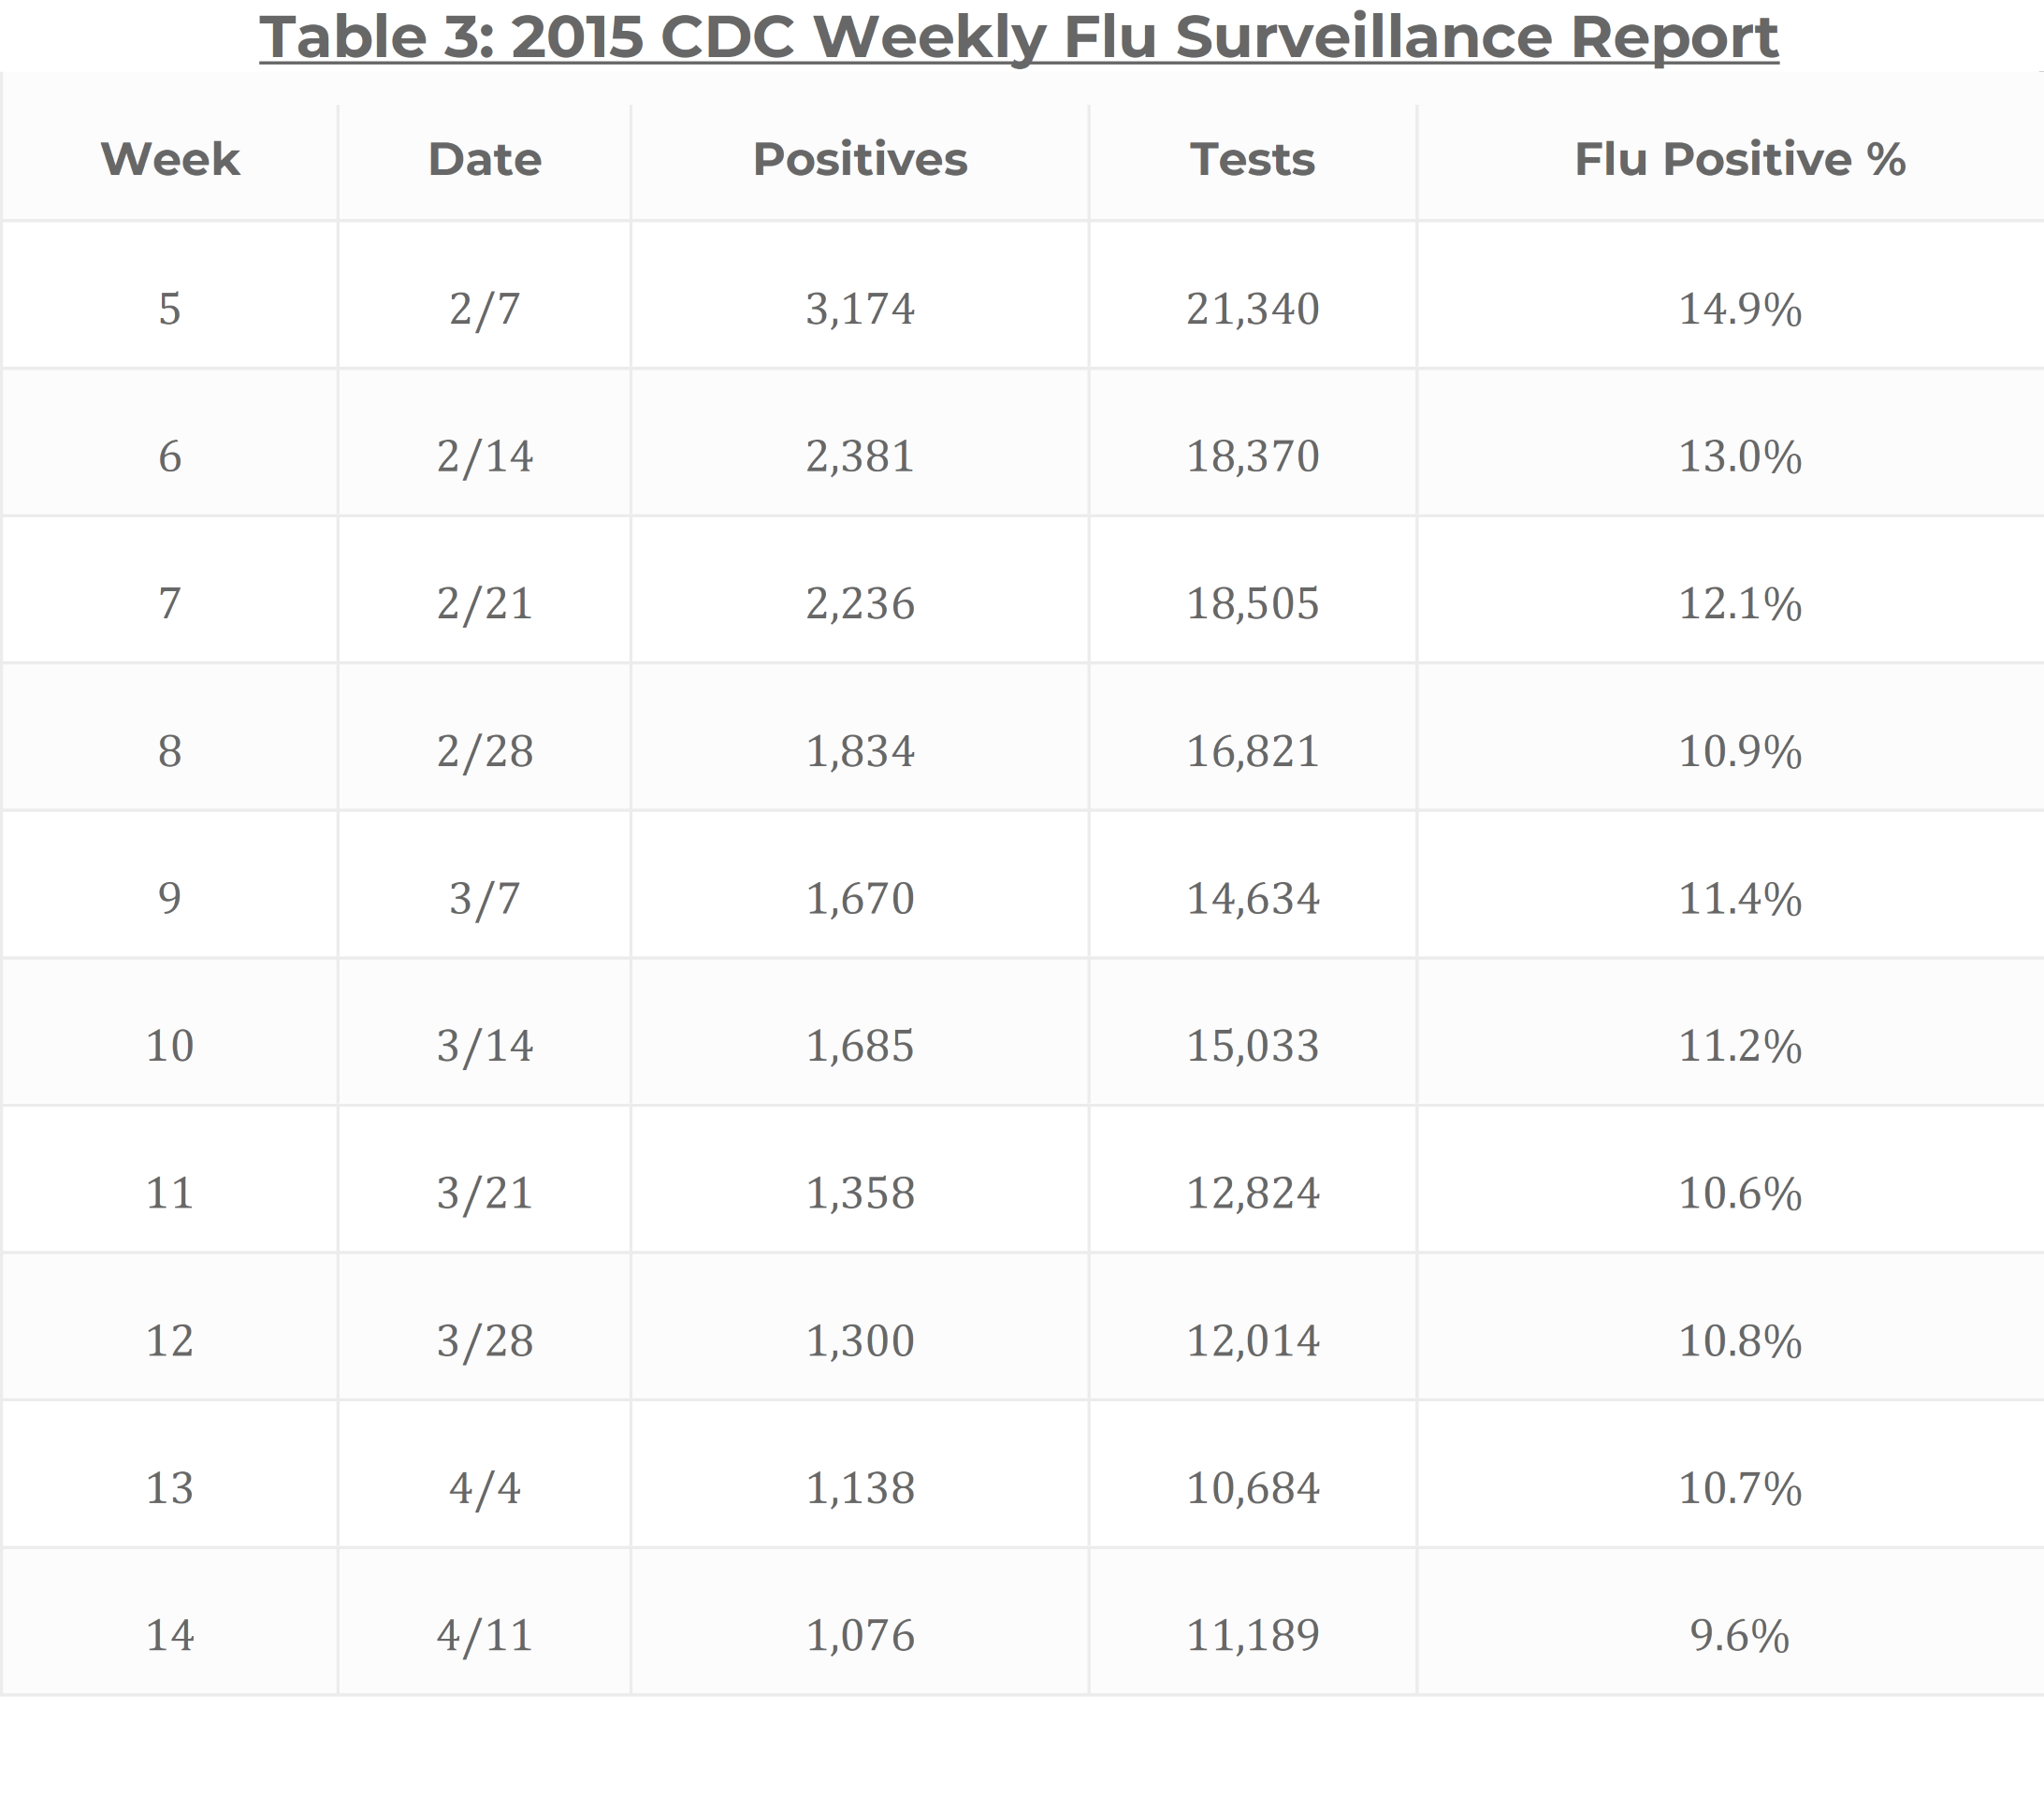
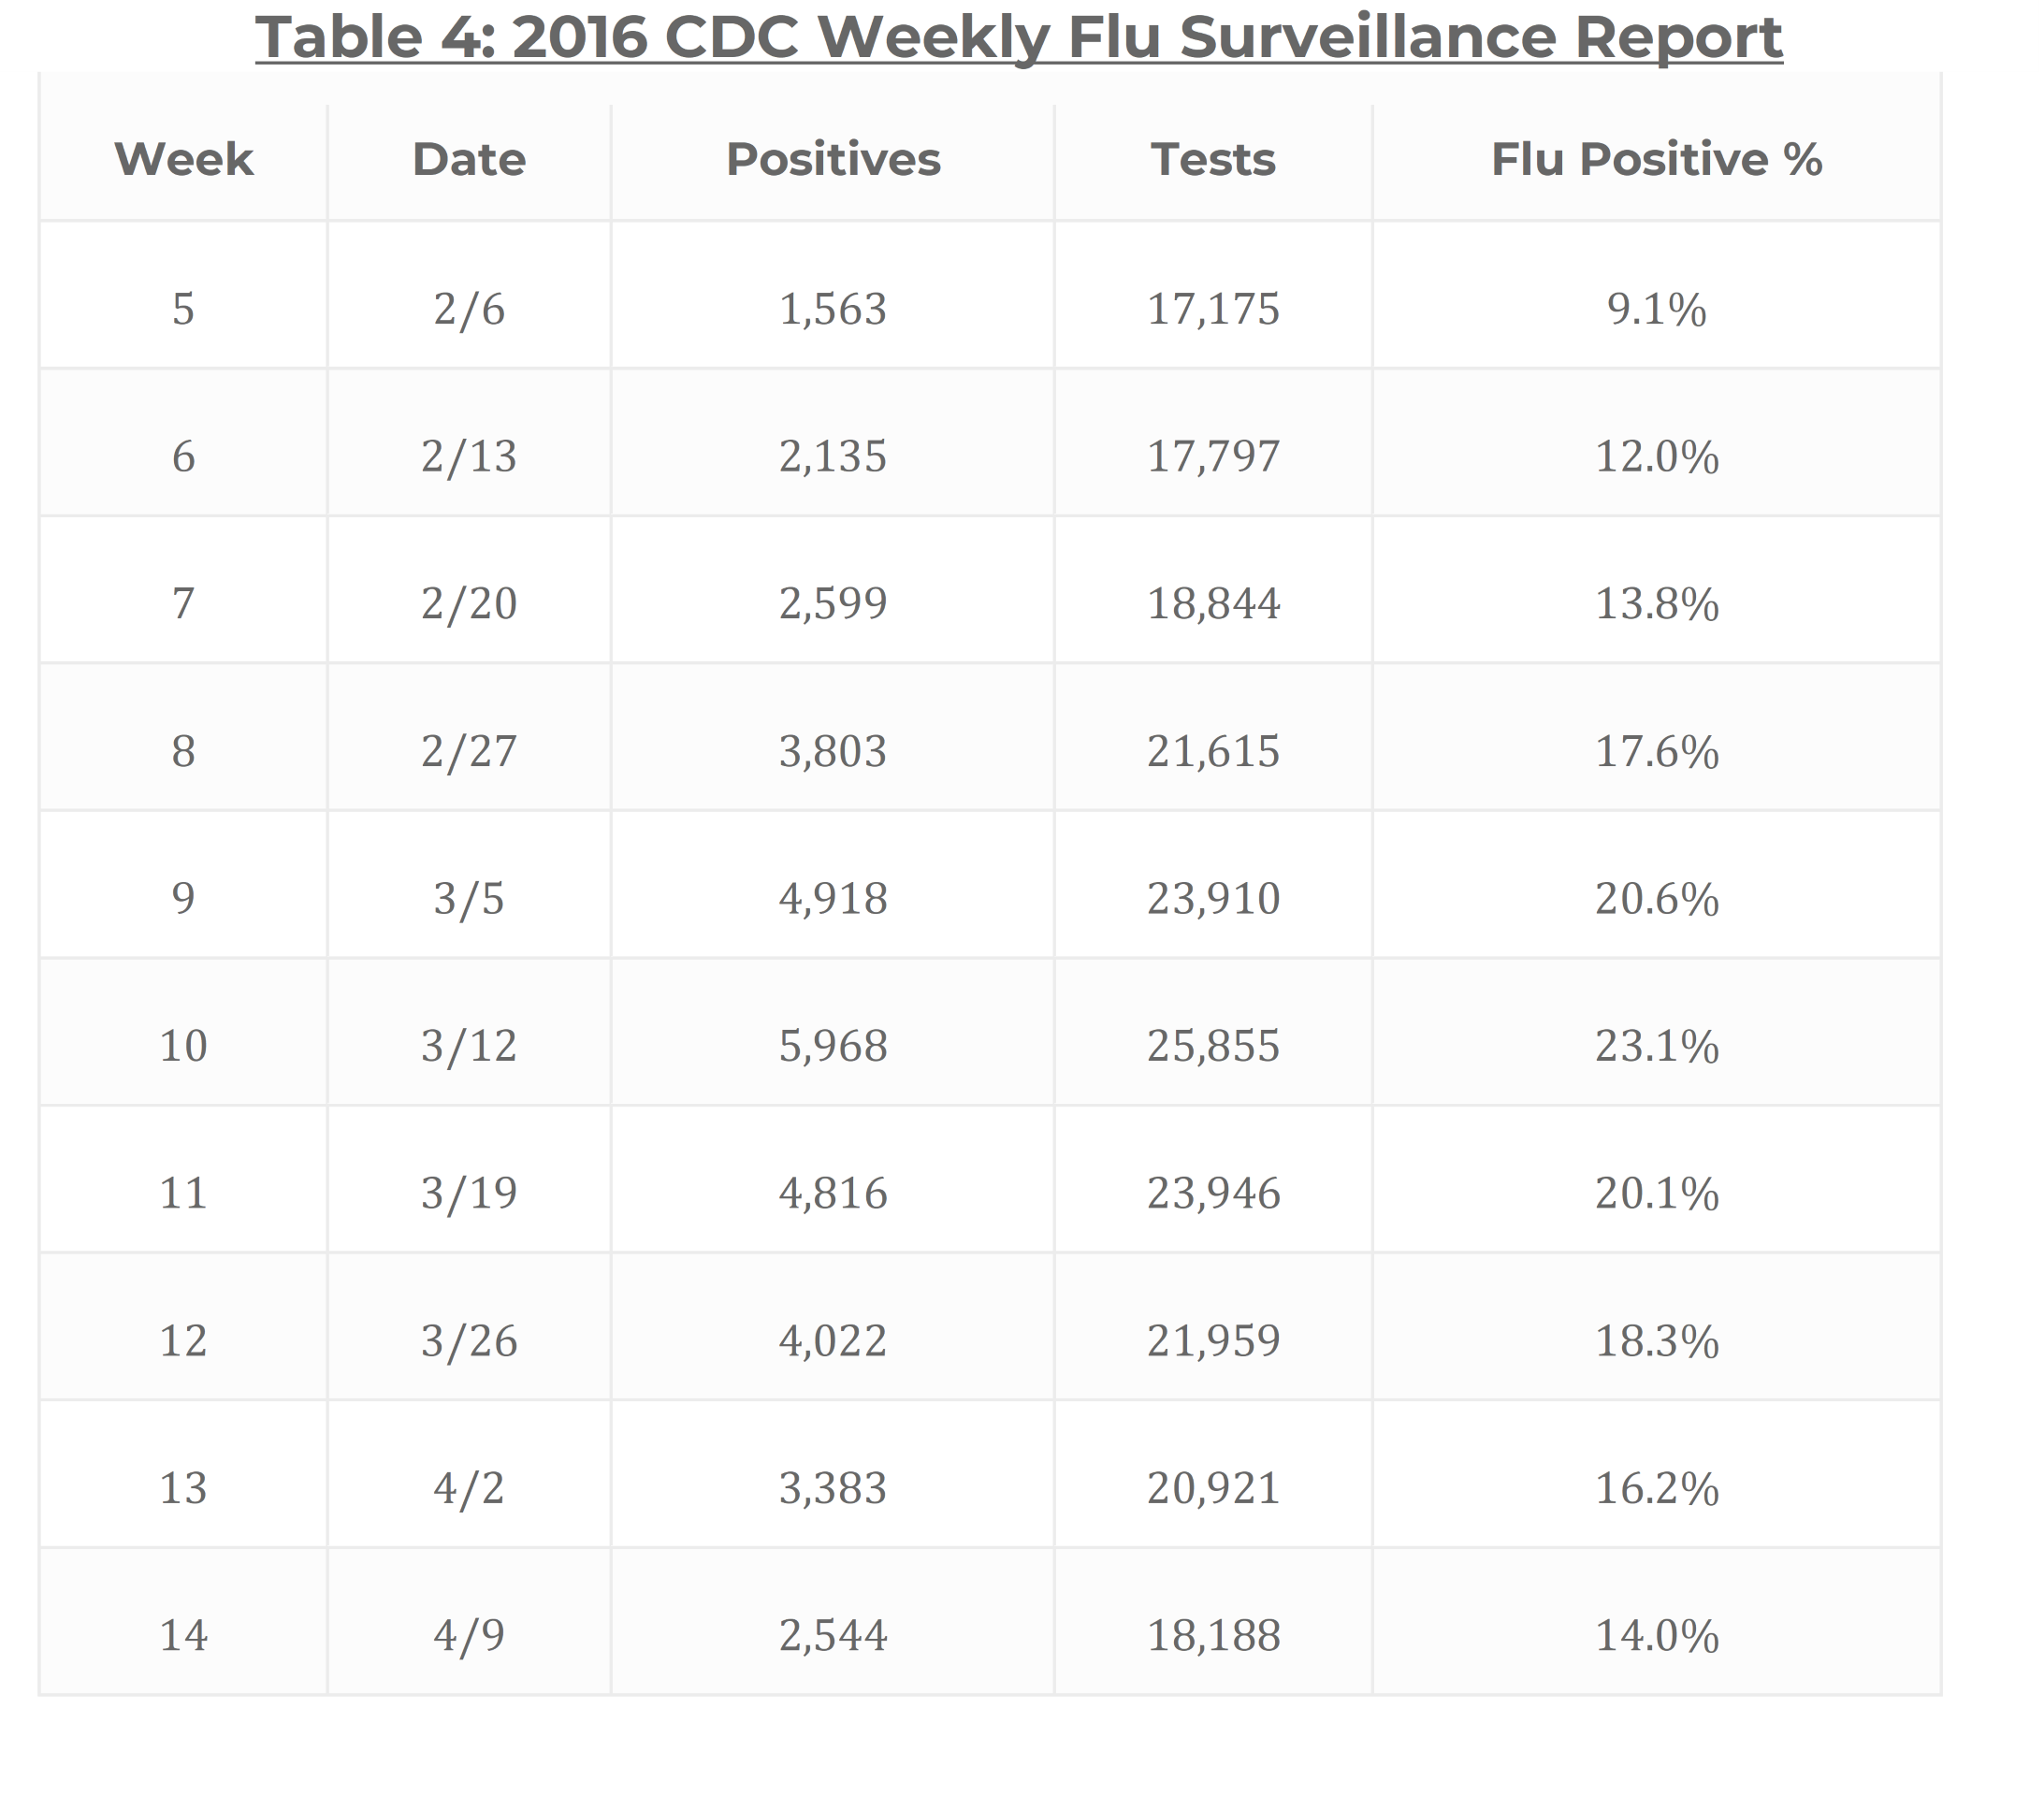
An examination of Tables 1-4 (2013-2016), illustrates how the flu numbers calculated by the CDC, week in and week out, produce remarkably consistent seasonal trends. Historically, ‘flu positive’ numbers are highest right around February/March and gradually taper off as “flu season” dissipates and Spring settles in.
From these tables it is noteworthy that rate reductions of more than 2% from one week to the next are exceedingly rare, with rate declines over 3% virtually non-existent.
In short, upward spikes or steep drop offs of any kind – up to this point – simply do not happen.


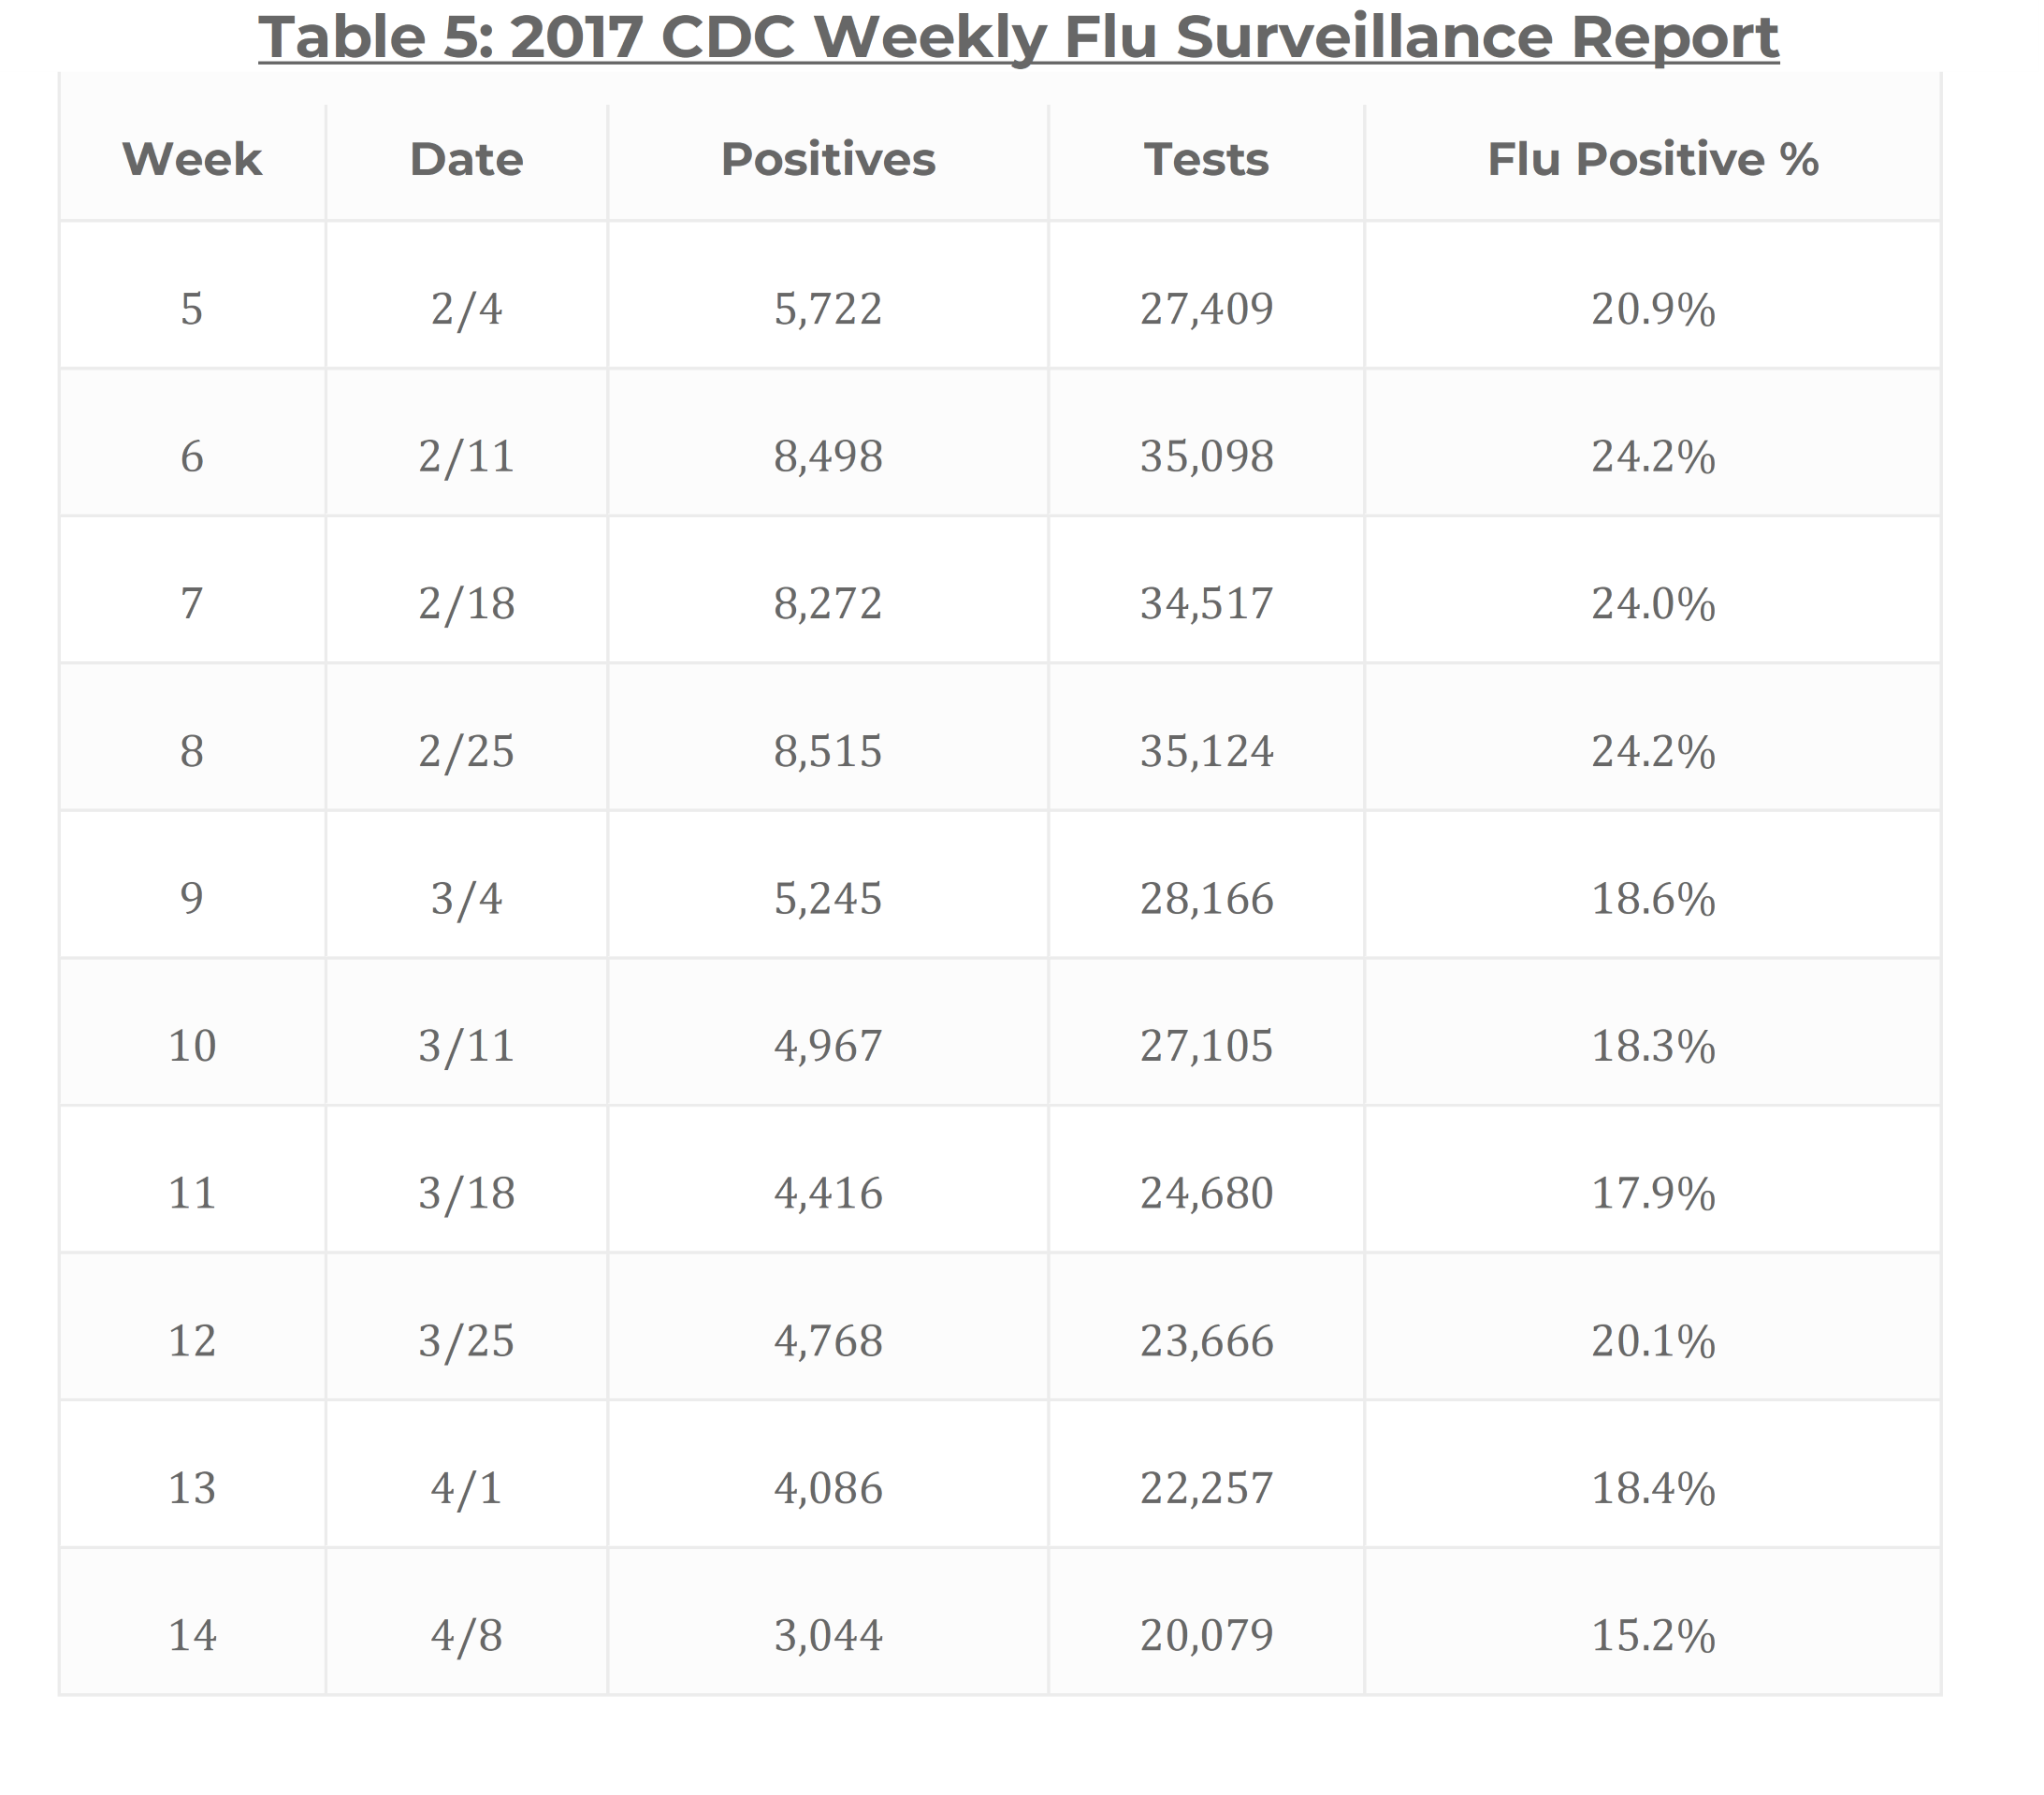
A shift occurred in 2017 as the CDC instituted a more aggressive testing system resulting in a significant increase in numbers across the board and much higher ‘flu’ percentages. Table 5 (2017) and Table 6 (2018) illustrate this notable change in the overall CDC flu surveillance numbers.
The previous record of tests given in any time frame, 25,855 tests, from Week 10 of 2016, was broken in 6 consecutive weeks in 2017. In 2018 that record was broken on 7 consecutive occasions and doubled in 3 of those weeks.
The overall percentages of flu positives during this time frame also reached record heights, going up an average of 3.5% per week.
Put simply: many more people were getting tested, more people were diagnosed with the flu and a higher percentage of those tested were found ‘positive.’
Why the CDC began such a dramatic acceleration in their testing regime is certainly an important question but not the purpose of this survey.
It’s important to emphasize that overall seasonal trends remained the same even with considerable increases in testing, increases in overall “cases” and rate increases. In other words, there was no deviation from the historical trend of ‘flu positives’ increasing in February/March, and tapering in early April.


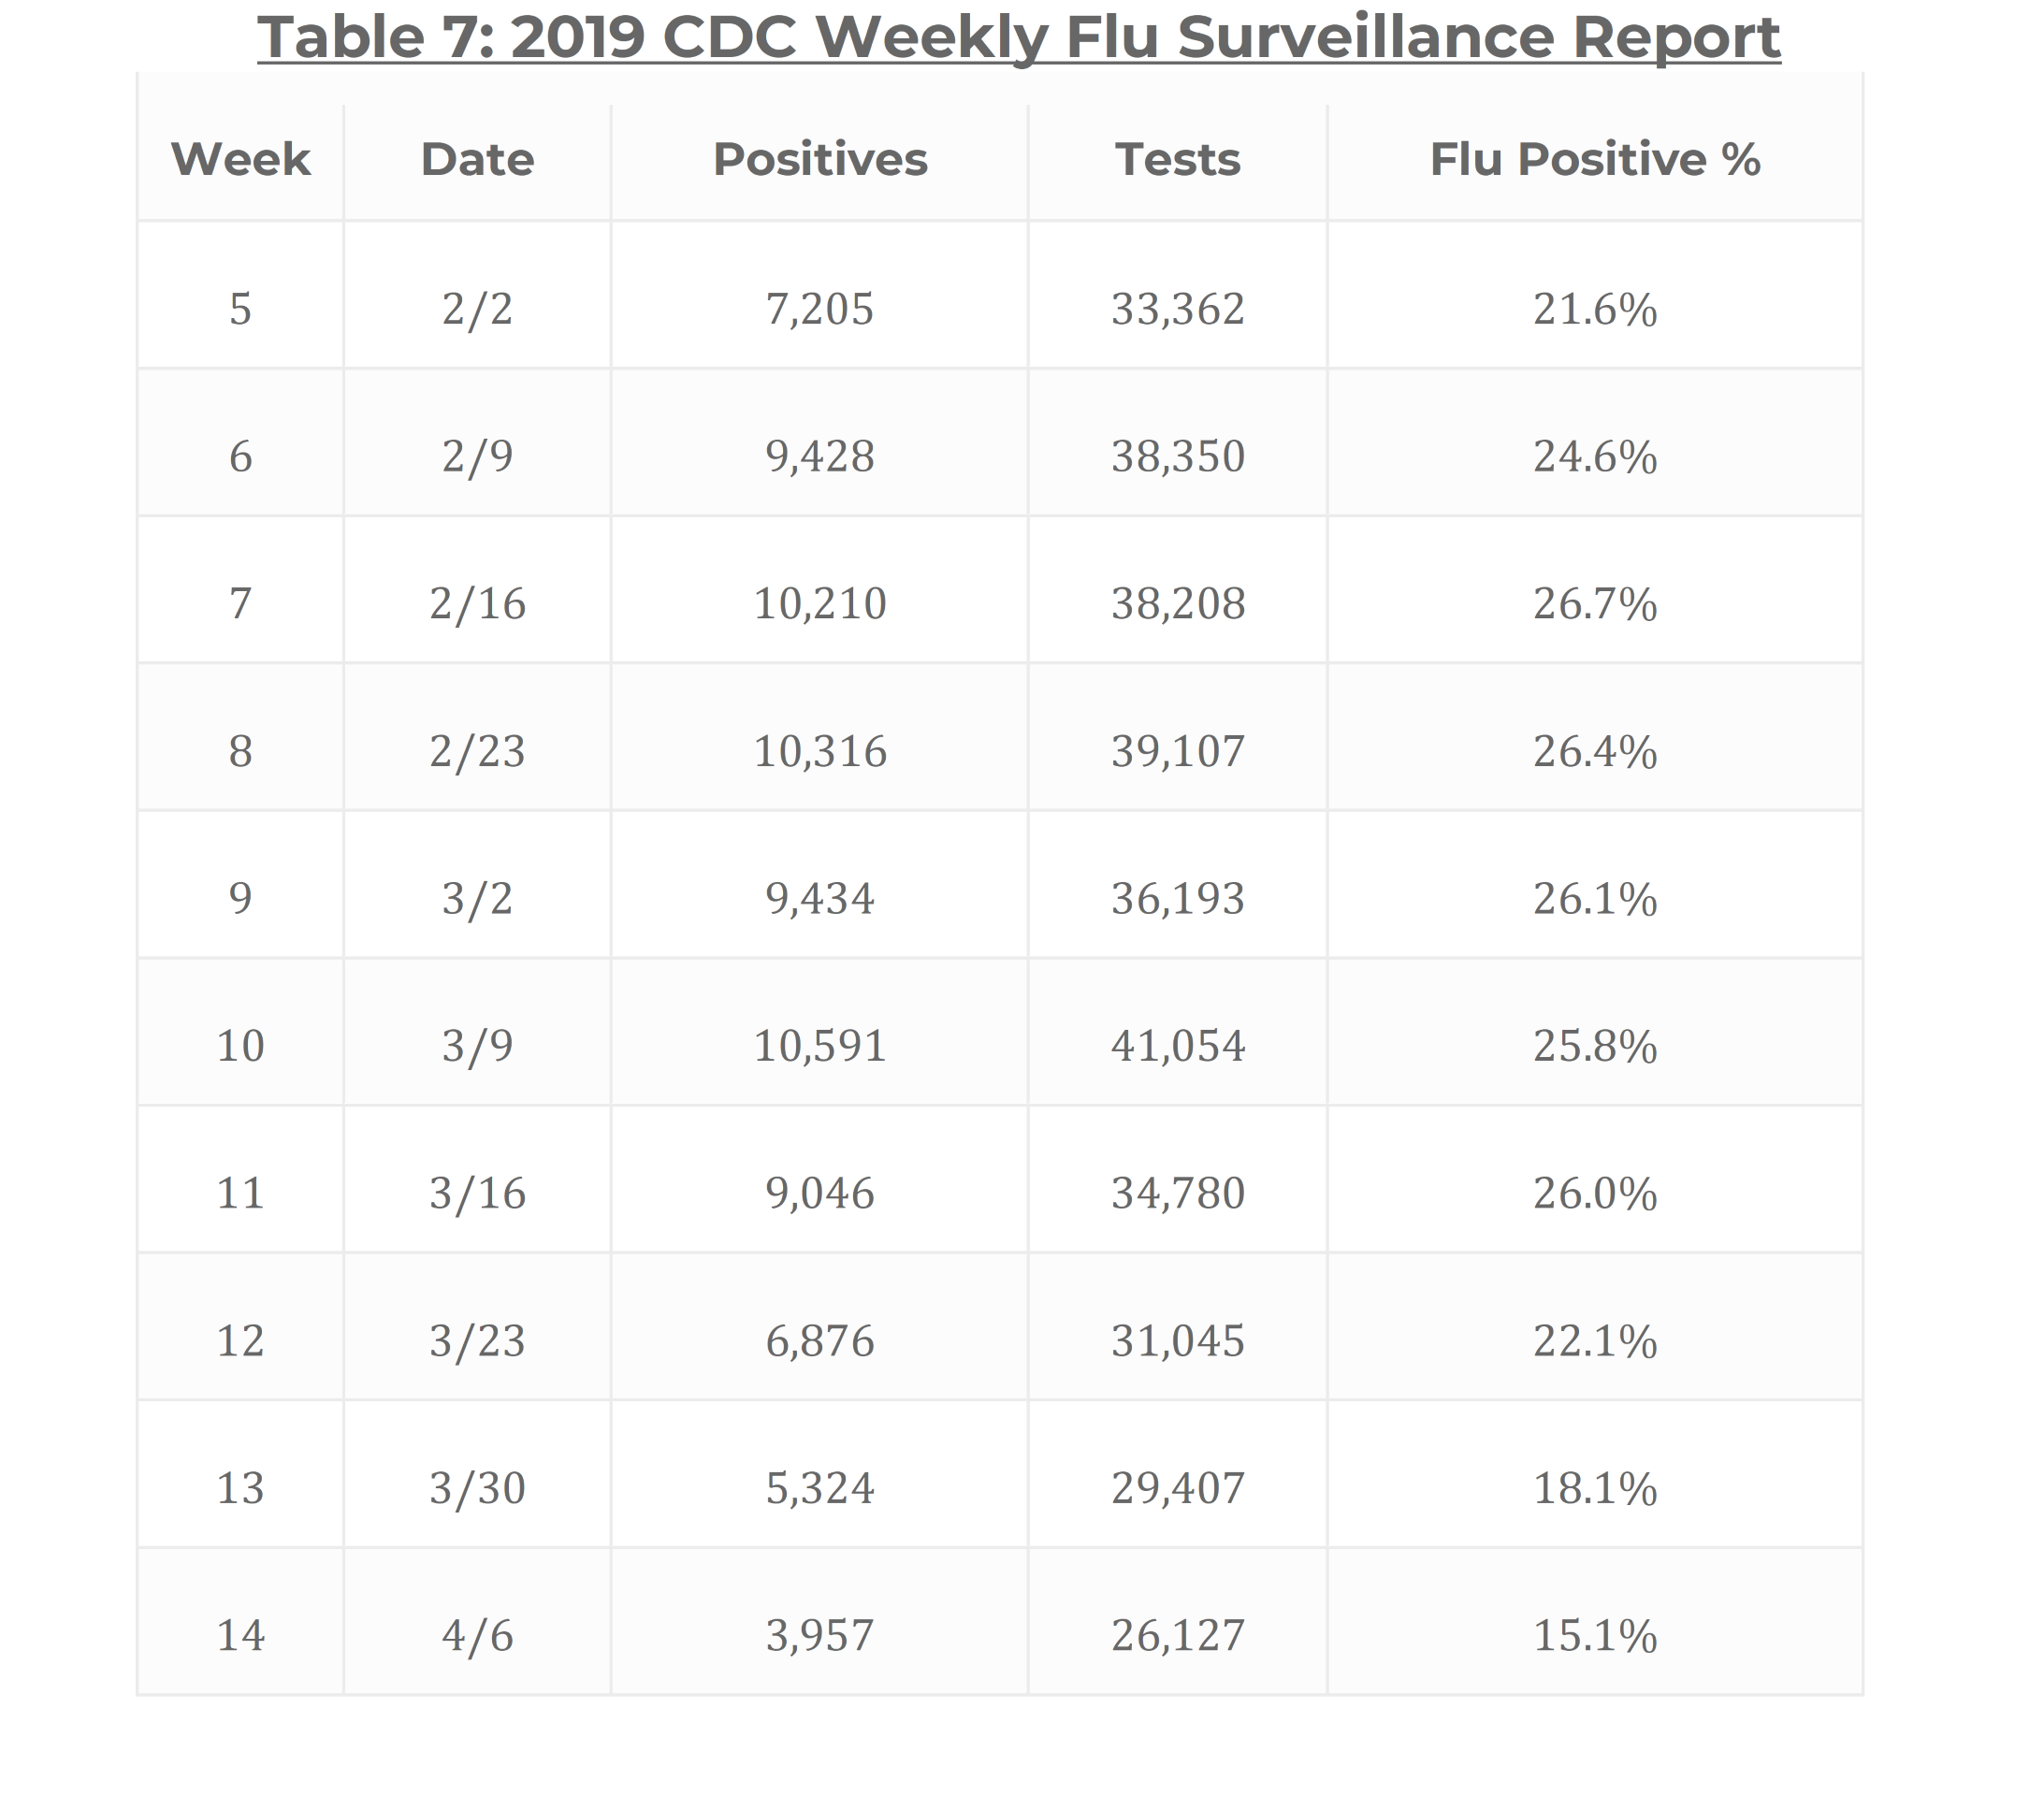
Table 7 (2019) represents the same pattern noted in Tables 5 and 6.
As in 2018 the testing numbers remained high – every single one of Weeks 5-14 of the 2019 CDC Flu Surveillance Report exceeded that past record of 25,855 from 2016.
Equally notable, 5 out of those 10 weeks in 2019 cited ‘flu positive’ numbers of 20% or more. A look back at our tables shows that the overall composite of ‘flu positives’ in 2019 was at an all-time record high – an overall increase of 3% weekly over 2017’s previous record.
If we go back to our earlier tables, 2019 represented a remarkable overall weekly increase in flu positives of 8% each week compared to 2013 and 11% when compared to the weekly average in 2015.
Again, while the overall percentage of ‘flu positives’ continued to rise in 2019 the overall seasonal trend still remained the same- numbers moving slightly upwards from week to week then tapering gradually as we moved into April.

Before examining Table 8 we need to remind ourselves that, according to the CDC, 2020 opened up as a ‘severe’ flu season. Table 8 sees that prediction take a sharp reversal that coincides with the arrival of Covid-19.
As shown in Table 8 the Week 5 test numbers were quite robust. Only one other season, 2018, had seen so many tests administered during either Weeks 5, 6 or 7 – no other season was anywhere close to these numbers.
In these three early weeks of 2020 the CDC ‘flu positives’ represented the three highest rates of ‘flu positives’ ever recorded in the CDC’s 22 year history of tracking the flu. An inspection of the CDC flu data makes it impossible to ignore the historic numbers of Weeks 5, 6 and 7.
What came next was even more incredulous.

The historical trend of the ‘flu’ tapering ceased in Week 10 (March 7th, 2020) as the ‘flu positive’ numbers dropped off a cliff.
Week 10 (21.5%) to Week 11 (15.3%) saw a precipitous fall of 6.2%. Week 11 (15.3%) to Week 12 (6.9%) ‘flu positives’ dropped an astonishing 8.4% in a single week.
By the time we reach Week 13 of 2020 (Table 8) ‘flu positives’ dropped to 2.1%. By Week 14 the ‘flu’ becomes virtually non-existent at 0.8% rate of positivity.
While fewer tests (22,324) were conducted in Week 14 of 2020 compared to earlier weeks, they still represent the 2nd highest overall Week 14 tests in all CDC records. Yet, only 0.8% ‘flu positives’ were registered for Week 14 compared to the preceding 7 year average of 12.5% for that same week.
Quite simply there was no historical analog for this event. For all practical (and statistical) purposes the flu no longer existed.
Anyone who works with data knows such sudden jolts are alarm bells. In the real world this usually indicates some problem with data-gathering and/or accounting methodologies as nature’s data always hugs its bell curves.
Given the bizarre circumstances of this unparalleled statistical outlier, multiple questions demand an answer.
How did flu rates go from all-time highs in Weeks 5,6 and 7 of 2020 to all-time lows in Weeks 13 and Weeks 14 of the same year?
Was the flu simply rebranded and repurposed with a more frightening viral event?
Is it possible the CDC decided after all these years that the flu, which generated billions in profit for Big Pharma, must be supplanted by a “deadlier” and more profitable virus?
CODA
On Oct. 28-29, 2019 The Milken Institute hosted “The Future of Health Summit”, which “brought together thought leaders and decision-makers to confront some of the world’s most significant health challenges by matching human, financial, and educational resources with the most innovative and impactful ideas.”
One of the more notable discussions of this two-day affair happened on the 29th: a panel of “health experts” gathered to discuss the “scientific and technological prospects of an effective universal influenza vaccine.”
The full video of that conversation can be seen here on C-SPAN.
Speakers included Dr. Anthony Fauci, director of the National Institute of Allergy and Infectious Diseases; Margaret Hamburg, former FDA commissioner; Bruce Gellin, President, Global Immunization, Sabin Vaccine Institute; Casey Wright, CEO, FluLab; Michael Specter, New Yorker staff writer and adjunct professor of bioengineering at Stanford University; and Rick Bright, the director of HHS Biomedical Advanced Research and Development Authority (BARDA).
The focal point of this panel discussion was, “the need for more funding for research, better collaboration between the private and government sectors, advances in technology in flu research and the goal of a universal flu vaccine.”
Two overall themes emerged from this meeting. The first idea highlighted the desire for a new way of producing vaccines. Anthony Fauci lamented that bringing in a new type of vaccine, like an mRNA vaccine, would take at least a decade “if everything goes perfectly.”
Rick Bright suggested the problem of long term development could be sidestepped if…
“there were an urgent call for an entity of excitement that is completely disruptive and is not beholden to bureaucratic strings and processes.”
The second issue featured the “need” for something new and more frightening to emerge as the flu no longer created enough fear in the population at large to warrant such a “universal vaccine.”
Anthony Fauci addressed this hitch:
So we really do have a problem of how the world perceives influenza and it’s going to be very difficult to change that unless you do it from within and say, I don’t care what your perception is, we’re going to address the problem in a disruptive and in an iterative way because she does need both.”
Responding to Fauci’s comment Rick Bright stated, “But it is not too crazy to think that an outbreak of a novel avian virus could occur in China somewhere. We could get the RNA sequence from that, to a number of regional centers if not local, if not even in your home at some point, and print those vaccines on a patch of self-administer.”
With the disappearance of the flu and the emergence of Covid-19 both those problems were solved.