Published: March 21, 2021
Share on: Twitter / Facebook
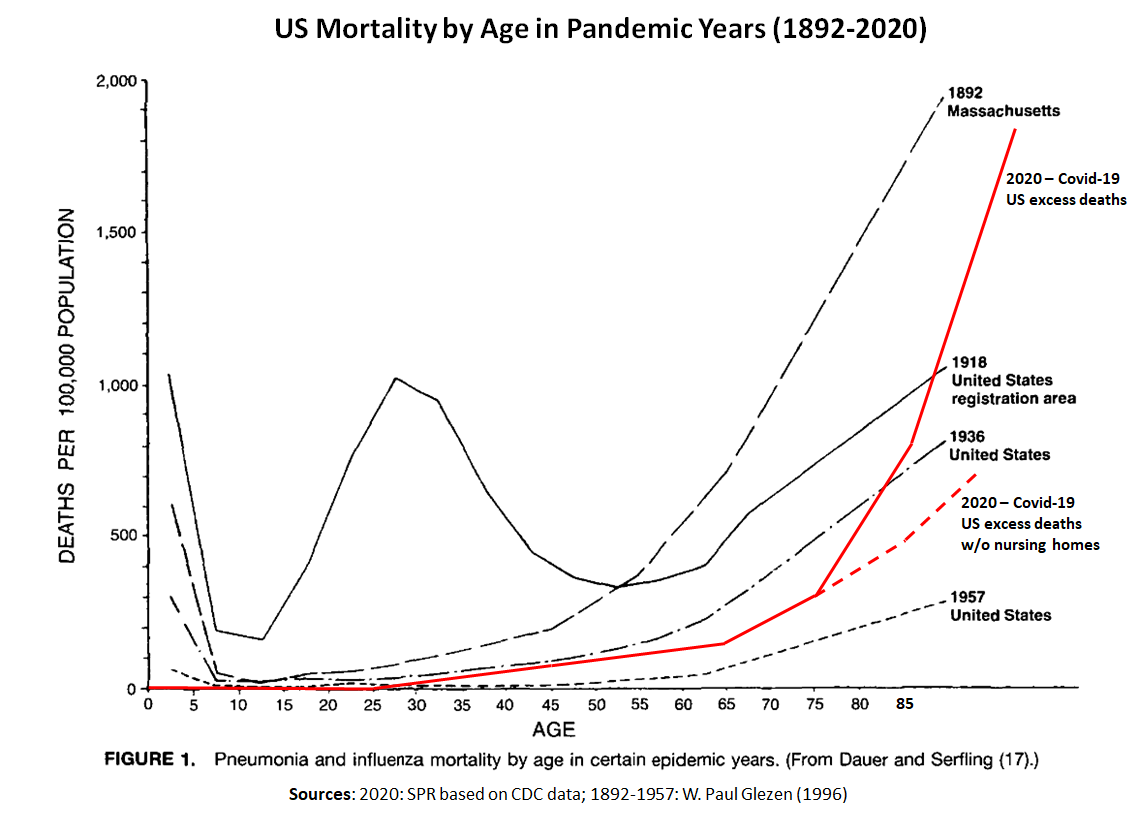
The legitimacy of comparing covid-19 and “the flu” has been a heatedly debated topic during the current pandemic. To clarify the situation, the above chart shows US influenza and pneumonia mortality by age in previous pandemic years compared to 2020 US excess mortality, which consisted primarily (>75%) of confirmed and suspected covid-19 deaths, according to the CDC.
As can be seen, up to about 75 years of age, 2020 mortality ranged between the 1957 “Asian flu” and the 1936 flu. Above 75 years, and especially above 85 years, 2020 mortality increased steeply and surpassed even the 1918 flu. This very steep increase was primarily driven by deaths in nursing homes (solid vs. dashed red lines), which accounted for about 40% of all US covid-19 deaths. The combination of a very high mortality in the elderly, and a high proportion of the elderly in modern Western societies, led to a very high overall mortality impact of covid-19.
Clearly, 2020 did not encompass all US covid-19 deaths (the peak of the second wave was reached in mid-January 2021), but earlier pandemics also extended over two to three years. Furthermore, in 2020 there were “lockdowns” in many US states; however, during earlier pandemics, measures such as face masks and school closures had also been employed. Moreover, a comparison of covid-19 mortality in California and Florida, for instance, indicates that most anti-pandemic measures in 2020 were of very limited utility. Finally, against both the 1957 and the 1968 pandemic influenza viruses, an effective vaccine was available within months.
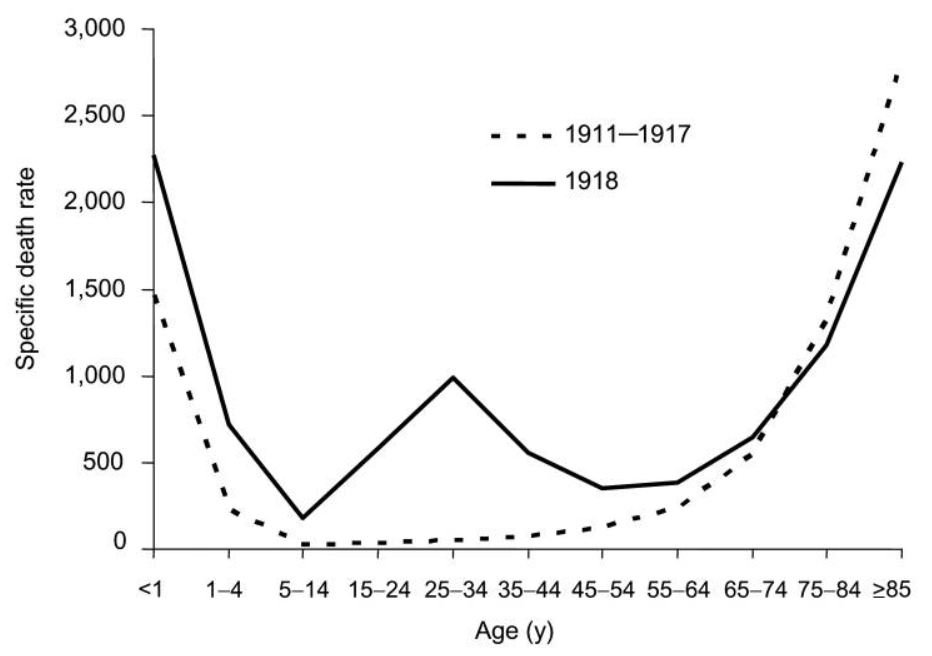
Another noteworthy aspect is that the 1918 influenza actually had a very limited mortality impact on people over the age of about 45 years (see figure below); it is generally thought that these people benefited from some degree of immunity due to exposure to a similar influenza virus that had been circulating in the 19th century, prior to the 1890 pandemic. In fact, 99% of excess influenza deaths in 1918 were in people younger than 65 years. Similarly, the 1957 influenza pandemic had a limited impact on people over 70 due to some degree of prior immunity, acquired in the 19th century.
In contrast, no such prior immunity existed against the novel SARS coronavirus. As a result, the age profile of the covid-19 mortality resembles most closely the 1889-1892 pandemic (see figure above), which some researchers believe was also caused by a then novel coronavirus (OC43).
See also: Covid-19 Mortality: A Global Overview
Addendum
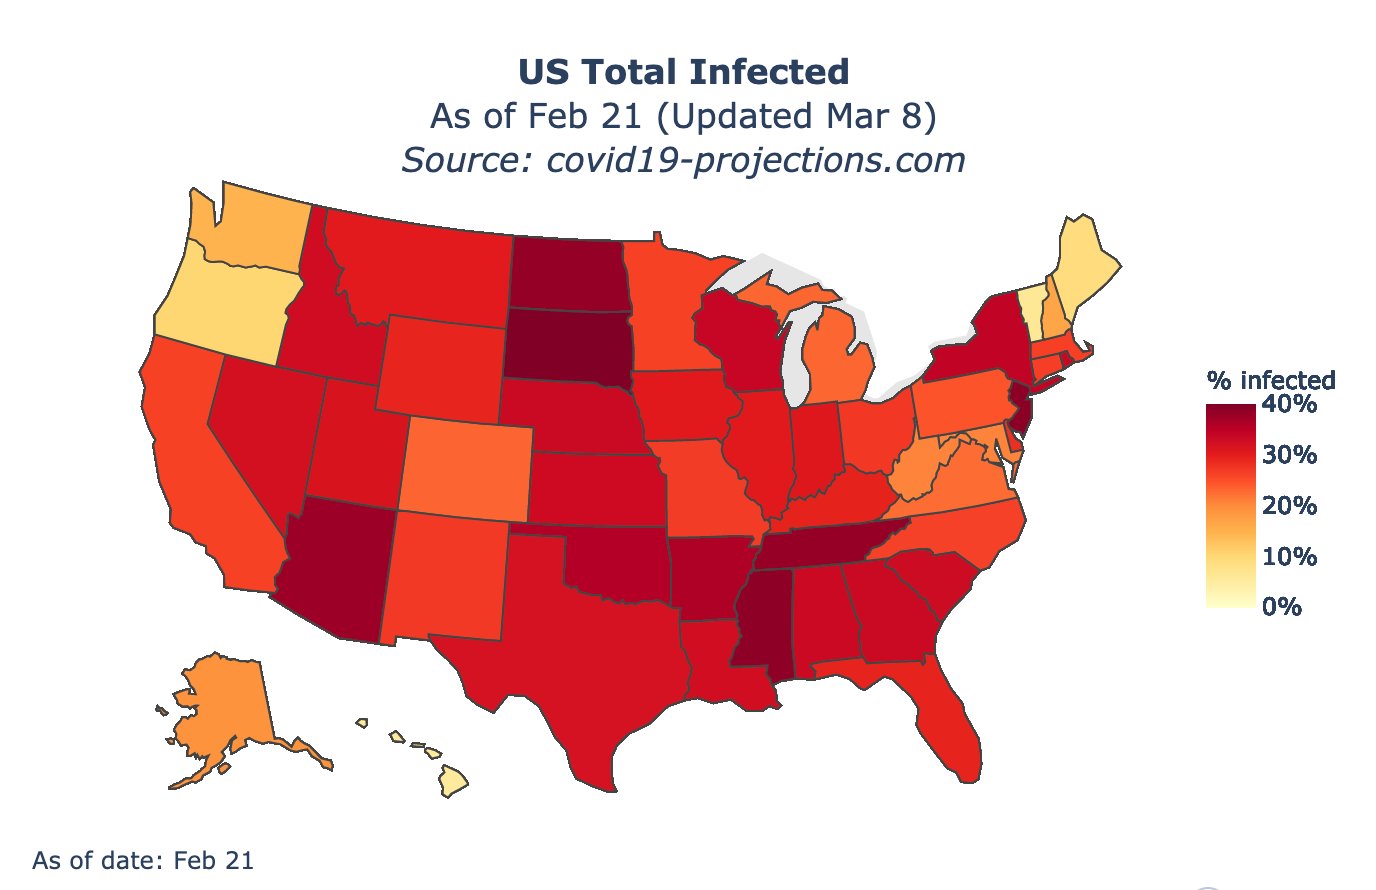
1) Coronavirus infection level per US state
The following map shows the total coronavirus infection level per US state by late February 2021, as projected (i.e. not measured) by Covid19 Projections. The infection attack rate was lowest in the northwestern and northeastern corners (5% to 15%) and highest in South Dakota (47%).
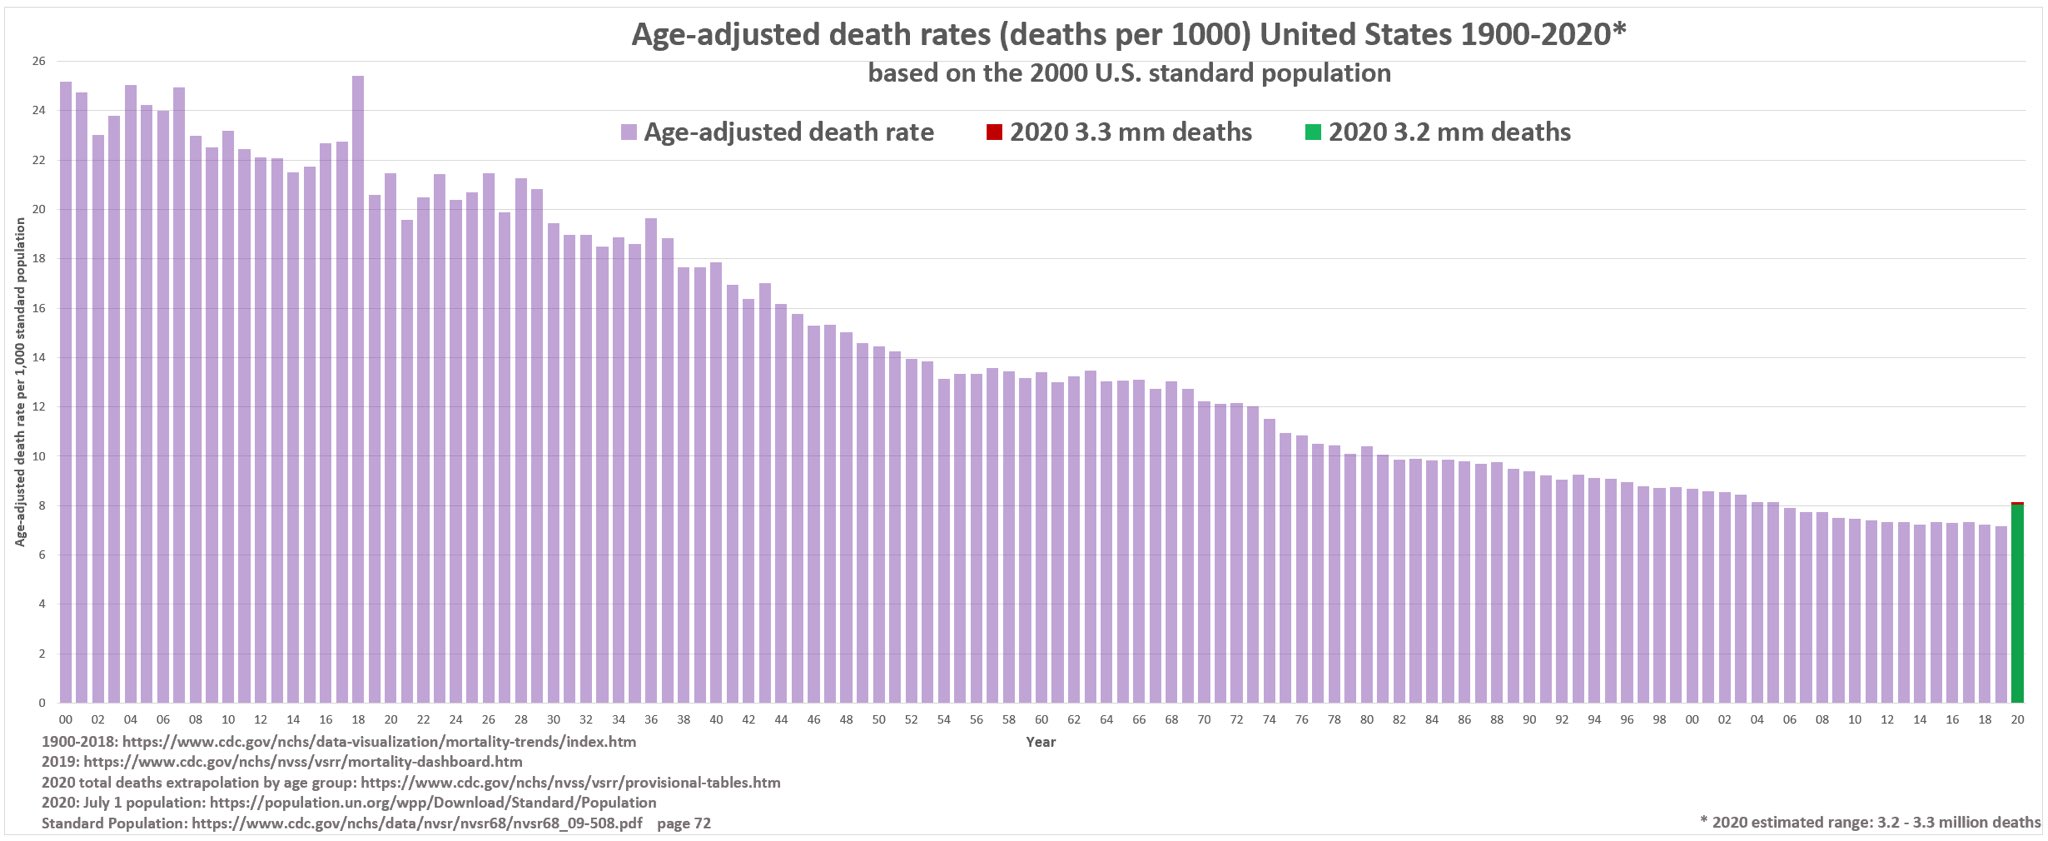
2) Age-adjusted mortality, 1900-2020
The following chart shows US age-adjusted mortality form 1900 to 2020. To take population ageing into account, the mortality of each year was applied to the US standard population of the year 2000. US age-adjusted mortality in 2020 was similar to mortality in 2004.
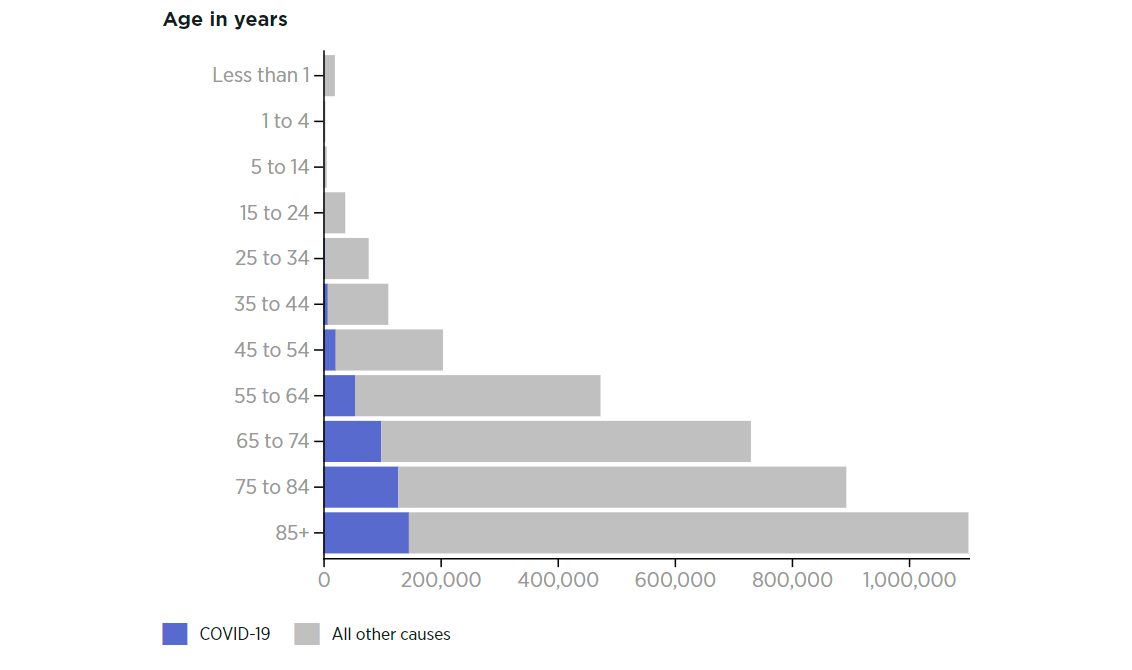
3) Covid deaths by age group
The following chart shows the number of US deaths from or with covid (blue) and from all other causes (gray), per age group, from February 2020 to February 2021, based on CDC data: