The Holocene Thermal Optimum ended
at different times in different parts of the world, but it had ended everywhere
by 4,000 BP (BP here means the number of years before 2000) and the world began
to cool. The timeline shown
in Figure 1 shows the GISP2 Central Greenland ice core temperature proxies in
blue and the HadCRUT 4.4 surface
temperature estimates for the same area in red.

Figure 1 (click on the link to website below to download in full resolution)
Major events in human civilization are noted on the graph. If you download the pdf it prints well on 8.5×11 inch paper. This timeline provides more detail for the last 4,000 years than I could fit on my previous timeline to 18,000 years. The principle reference for the ice core study can be seen here. At the top of the graph the Blytt and Sernanderclimate periods are noted, these periods are based on their studies of Danish peat bogs and the names are still used in the literature.
Major events in human civilization are noted on the graph. If you download the pdf it prints well on 8.5×11 inch paper. This timeline provides more detail for the last 4,000 years than I could fit on my previous timeline to 18,000 years. The principle reference for the ice core study can be seen here. At the top of the graph the Blytt and Sernanderclimate periods are noted, these periods are based on their studies of Danish peat bogs and the names are still used in the literature.
Of necessity, this post covers the climate and human events in
the northern hemisphere. Some of the climatic events described, like the Medieval Warm Period,
were worldwide events. But, some may have only occurred in the northern
hemisphere. Nearly all of the historical notes are from Professor Wolfgang
Behringer’s excellent book A Cultural History of Climate. The book was suggested to
me by Dr. Ronan Connolly and
I highly recommend it. It was originally published in German in 2007, I read
the 2010 English translation byPatrick Camiller.
The translation is quite good and the book is very readable, even addicting.
The GISP2 temperature record covers the interval from 95 years
ago to 50,000 years ago. I pulled a Michael Mann “trick” and spliced measured
Greenland (HadCRUT 4.4)
surface temperatures onto the ice core record to bring the graph up to the year
2000. That way it shows the modern warm period. The spliced measured
temperatures are smoothed with a 20 year moving average. The HadCRUT 4.4 worldwide
gridded temperature anomalies were read from a NetCDF dataset.
The R script for reading and mapping the data can be seen here. The
script is in a Word file due to WordPress restrictions, save it as an “.R” text
(ascii) file if you want to run it.
The worldwide HadCRUT temperature anomaly grid is a 5° by 5°
grid and many of the points over Greenland are unpopulated (null). The
populated points near the GISP2 ice core site were averaged over the 166 year
span of the record (since 1850). The points used and the location of the GISP2
ice core are shown in Figure 2 (made with Google Earth) below. The smoothed
anomalies were added to the ice core temperature average in the overlapping
interval, from 1850 to 1905.
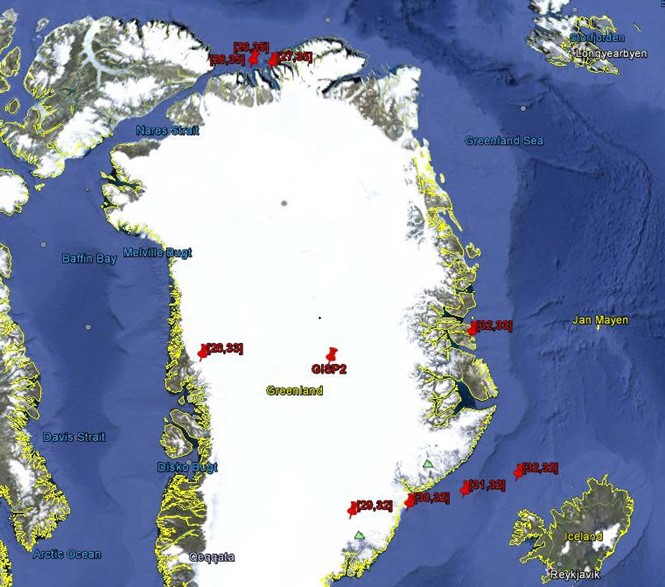
Figure 2
Ice core data from this far north are very useful. It has long
been known that ocean and atmospheric temperatures at or near the equator have
not changed much for millions of years, but temperature changes at the poles
have been large, especially near the North Pole. This has often been called “polar amplification.”
As global temperatures rise, evaporation increases in the tropics keeping
tropical temperatures steady. As temperatures are “evaporatively buffered”
in the tropics, global energy balance constraints force temperatures to
increase in the high latitudes during a global warming event. So data from this
far north show larger temperature swings than the world at large and they are
easier to see.
Newell and Dopplick computed
that the maximum temperature of the atmosphere over the ocean is 303K or 30°C
(see also Hoffert, et al ).
This is very similar to the equatorial sea surface temperature today (see
Figure 3) and going back to the Cretaceous Period 65 million years ago. In the
Cretaceous the higher sea surface temperatures covered much more of the oceans
and there was no polar ice. They conclude that 30°C is the limiting temperature
based on the balance between radiative input energy and energy lost due to the
evaporation of sea water. Because the world ocean heat capacity is 1,000 times
the heat capacity of the atmosphere, this is a very reasonable conclusion. For
the details of the heat capacity calculation see the spreadsheet here. One
should also consider that while the equatorial ocean surface temperature is
about 30°C (Figure 3), the temperature of the world ocean at 2000 meters depth
is only about 2°C. For this
reason, the oceans are a huge temperature dampener, making the idea of a
runaway atmospheric temperature increase unlikely.
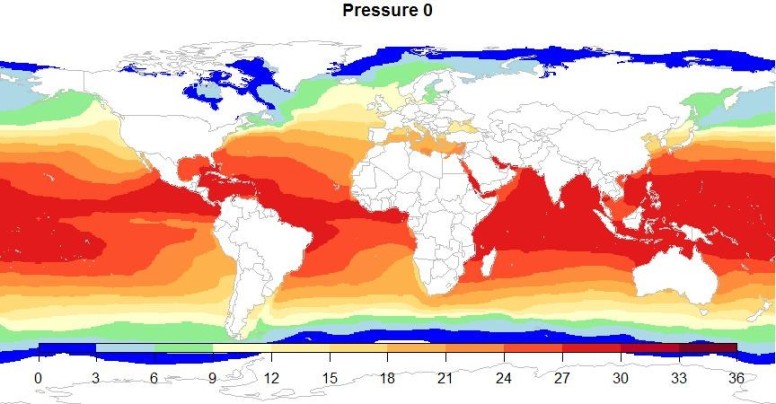
Figure 3, Modern Ocean surface temperatures, whole year average,
Deg. C (NOAA MIMOC)
Comparing northern hemisphere human history to the Greenland ice
core record, it is apparent that large swings of temperatures in Greenland are
related to European, Middle Eastern, Asian, and American events. Thus, we can
safely assume these temperature swings affected most, if not all of the
northern hemisphere. Behringer discusses this relationship in rich detail in
his book. Comparing Antarctic ice core temperature proxies to the Greenland ice
core records shows that the shorter events are different, or
occur at different times in the southern hemisphere. The major events, for
example the last glacial maximum and the Holocene Thermal Optimum (when human
civilization began, the so called Neolithic Revolution) are apparent in both
records.
The timeline begins at 4,000 BP and it shows steady cooling to
the Little Ice Age (roughly 1250 to 1850 AD). It is easy to see that the Roman
Warm Period was cooler (at least in Greenland) than the Minoan Warm Period and
the Medieval and Modern Warm Periods are cooler than the Roman Warm Period. The
Little Ice Age was a horrible time for mankind according to Behringer. Glaciers
advanced in the Alps and destroyed homes, it was a time of perpetual war,
famines and plagues. Horrible persecutions of Jews and “witches” were common.
Society was suffering from the cold and lack of food and they needed to blame
someone. They chose Jews and old unmarried women unfortunately. Over 50,000
witches were burned alive. Tens of thousands of Jews were massacred. Not
because there was any proof, just because someone had to suffer for the bad
climate. Some people, the masses mainly, seem to need to blame someone or
humanity’s sins for natural disasters. Behringer notes that in The Little Ice
Age: “In a society with no concept of the accidental, there was a tendency to
personalize misfortune.”
Today environmental zealots assume that climate change is not
only man-made but dangerous. They have no proof of either assertion, of course,
but they “believe” with religious fervor in both ideas. Then we see, in
Behringer’s book, the following quote from Archbishop Agobard of Lyons (769-840
AD) in his sermon “On Hail and Thunder:”
“In these parts nearly everyone – nobles and common folk, town
and country, young and old – believe that human beings can bring about hail and
thunder…We have seen and heard how most people are gripped by such nonsense,
indeed possessed by such stupidity…”
Behringer offers up a 1486 woodcut of a sorceress conjuring up a
hailstorm, I show this below in Figure 4. Behringer labels this woodcut
“Anthropogenic Climate Change.” This is on page 129.
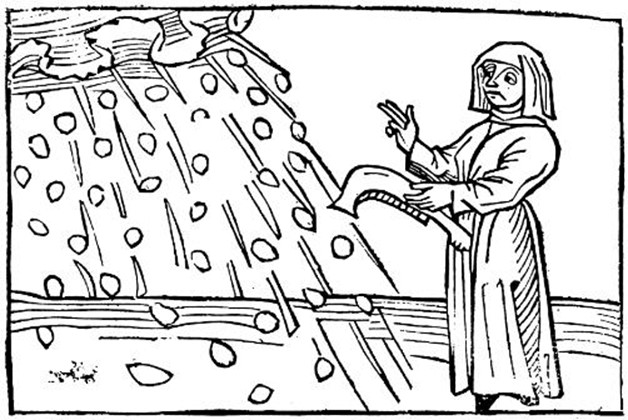
Figure 4: Anthropogenic Climate Change
One needs to ask “Have we, as a society, learned anything since
1486?” Why do some need to assume that certain people must be to blame for
natural disasters?
Conclusions
There are several lessons to be learned from Behringer’s book
and the timeline. First, there is no perfect temperature. Man, even in
pre-industrial times, adapted to a variety of temperatures and he has always
done better in warm times and worse in cold times. Second, why would anyone
want to go back to the pre-industrial climate? The Washington Post says
the goal of the Paris Climate Conference was get the world to agree to limit
global warming to less than two degrees above pre-industrial temperatures.
Pre-industrial times? That’s the Little Ice Age, when it snowed in July, a time
of endless war, famine and plague. According to the Greenland ice core proxy
data, temperatures 180 years ago were the nearly the coldest seen since the end
of the last glacial period 10,000 years ago! Why measure our success in
combating anthropogenic warming, if there is any such thing, from such an
unusually cold time? It makes no sense, those times were awful.
As Behringer explains, the Neolithic (new stone age) revolution
and the rise of ancient civilization became possible when temperatures
were one to two degrees warmer than
today. At the current rate of warming, even in polar amplified Greenland, this
will take at least 200 years to reach. Why not set the limit at two degrees
above the temperatures in the Holocene Thermal Optimum? That was the
temperature that allowed civilization to begin after all. I, for one, would
like to go back to that period much more than the Little Ice Age. Why have a
limit? Evaporation limits the maximum temperature to 29-30 degrees anyway, we
go to places with that temperature for a winter vacation all the time.
Currently temperatures are evaporatively buffered in the tropics
at 29°-30°C. The rest of the planet could rise to nearly this temperature over
many thousands of years, but it isn’t likely and it isn’t a catastrophe.
Further, the Earth has already been there in thePaleocene-Eocene Thermal
Maximum 55 million years ago and in the Cretaceous Period65
million years ago when the Earth was ice free and palm trees grew in both Alaska andAntarctica. If
warming continues, man-made or not, the ice at the poles will melt over time;
but we can move to higher ground, we can adapt. It will not happen quickly but
over many generations, most will not even notice it is happening. We are much
more advanced today can adapt more easily than our ancestors and they adapted
to even more extreme climatic events.
The last part of Behringer’s book is a good summary of the
climate change debate in 2007. We have to admire the way he presents both sides
of the debate in a “just the facts” manner. The following quote is from the
penultimate page of the book:
“…cooling
has always resulted in major social upheavals, whereas warming has sometimes
led to a blossoming of culture. If we can learn anything from the history of
culture, it is that, even if humans were ‘children of the Ice Age’,
civilization was a product of climatic warming.”
“The future is hard to foresee. Serious scientists should
refrain from slipping into the role of Nostradamus. Computer simulations cannot
be better than the premises that guided the input of data: they show what is
expected to happen, not the actual future. The history of the sciences is also
a history of false theories and wrong predictions.”
Not much to add to that.