Our USA Today Op-Ed "silently suggesting" vaccines cause excess mortality was inspired by damning data from the Society of Actuaries. Unsurprisingly, the report conclusions suggest self-censorship.

Part 1 of my posts on our USA Today Op-Ed can be found here. Here is Part 2:
Although the insurance industry, like any other, has profits for its shareholders as its primary goal, it is also an industry whose insights have led to a few centuries of life-saving public policies and laws which protect us from a large number of dangers to our health and survival. For instance, insurers have led efforts to advance safety in many fields:
•Maritime safety – standards
•Fire safety – fire departments and codes
•Boiler and elevator – standards and inspections
•Electrical products – standards & testing
•Worker safety – standards and policies
•Automobile safety – standards and testing
•Natural catastrophes – earthquake and hurricane codes
•Medical and health policy – establishing a focus on patient safety
That last goal of improving patient safety is now likely being threatened. The massive increases in group life insurance death claims reported by the insurance giant One America in late 2021 is what, to me, finally confirmed what many of us were seeing from other sources of data in terms of the vaccines being lethal. But now the most recent and wider group life insurance industry report falls short of doing so overtly. The data speaks loudly, but the SOA speaks much more softly, perhaps even corruptly (or at least cravenly).
Recall that shocking life insurance data burst onto the Covid vax/anti-Covid vax battlefield when Scott Davidson, the CEO of One America “made the mistake” of saying the following disturbing (and truly historic) comments at a news conference organized by the Indiana Chamber of Commerce in the last week of 2021 (below are some headlines in the wake of the event):

His quotes in that article:
“We are seeing, right now, the highest death rates we have seen in the history of this business – not just at OneAmerica,” the company’s CEO Scott Davison said during an online news conference this week. “The data is consistent across every player in that business.”
“the increase in deaths represents “huge, huge numbers,” and that’s it’s not elderly people who are dying, but “primarily working-age people 18 to 64” ( meaning employees of companies that have group life insurance plans through OneAmerica).
“And what we saw just in third quarter, we’re seeing it continue into fourth quarter, is that death rates are up 40% over what they were pre-pandemic,” he said.
“Just to give you an idea of how bad that is, a three-sigma or a one-in-200-year catastrophe would be 10% increase over pre-pandemic,” he said. “So 40% is just unheard of.”
“What the data is showing to us is that the deaths that are being reported as COVID deaths greatly understate the actual death losses among working-age people from the pandemic. It may not all be COVID on their death certificate, but deaths are up just huge, huge numbers.”
He also mentioned an “uptick” in disability claims, saying at first it was short-term disability claims, and later the increase was within the long-term disability claims. Ed Dowd and his team at phinancetechnologies.com have analyzed the official U.S government disability data. They found sudden, unprecedented, temporally associated increases in disability with the vaccine roll-out.

Quick aside: In the months after the article on One America’s data was published, I was invited, along with several colleagues, to speak on a zoom call with major life insurance corporation executives, actuaries and/or their representatives to discuss the data they were seeing and how and whether they could confidently identify (and subsequently announce?) to the public that this death and disability wave was being caused by mass vaccination of working age Americans.
What happened at and after the zoom call should not be shocking. Despite the industry’s history of boldly improving regulatory safety in a number of fields, almost every attendee’s camera was turned off, and only two people spoke or asked questions. One was a bold, unvaccinated chief actuary of a major company and the other a senior, state regulator of the life insurance industry.
Ultimately, at that time, given the lack of access to data on the individual vaccination status of all the death claims, it was concluded that a public statement by a group of them was not going to happen (which is what we had been hoping would result). However, it is my opinion based on that experience, that even if the data were definitive, I seriously doubt that group of people would have stood on the media and government “firing line” with us “dissident doctors.”
It has now been over a year since that meeting. The most recent U.S Society of Actuaries (SOA) Group Life Insurance quarterly report came out May 2023. Many of us anticipated even more damning evidence. The evidence was damning all right - but not the SOA’s interpretation of it. In fact, right on the first page of the report is this comment:
The Society of Actuaries Research Institute’s May 2023 report and its predecessor reports regarding U.S. Group Life COVID-19 mortality explore the impact of COVID-19 on the group life insurance sector and do not address or consider vaccine status. The research does not validate any claims made that suggest a causal relationship between COVID-19 vaccines and mortality. Any claims implying such a relationship are a misrepresentation of the data presented in the report and are not reflective of the SOA Research Institute's views.
Although it is true the SOA data does not definitively “validate” the claims of a causation or correlation, for the SOA to then warn that anybody who “implies” such a relationship would be “misrepresenting their data” goes too far. I believe an interpretation that vaccines were the cause is not a “misrepresentation” of their data but instead a compelling and seriously disturbing one.
I maintain that, using the civil and medical malpractice legal standard of “more likely than not,” the only interpretation you can arrive at is that the vaccines are the cause of the sudden rise in excess mortality in the U.S. I say this based on the lack of a rational, alternative explanation for the sudden, temporally associated increases measured.
Using the logic that temporal associations largely define cause, there is so much damning data in the report that anyone studying the issue should be alarmed enough by it to publicly scream for at least more analysis than the SOA was capable of. And that is what we did in our USA Today Op-Ed.
In their May 2023 report, at least the SOA mentioned the vaccines and even shared some analyses they had done to assess whether they could be a cause. But their conclusions, to me and others more expert in analyzing the actuarial data, strongly suggested either political influence or political fear given they wrote that their research “does not validate any claims made that suggest a causal relationship between COVID-19 vaccines and mortality.” They say this despite also finding “a small positive correlation” in 2022 between vaccination rates and excess deaths that was not statistically significant (more on that below). But get this, they go further and state that “since the association was not statistically significant, future reports will likely omit this sub-section.” You don’t say.
To review the report more in depth, I had help from a life insurance industry expert who more carefully reviewed the entire report and noted the following issues and limitations with both the report and the data contained in it.
First off, right at the beginning of the report, they report this chilling statistic:
The 33-month period of April 2020 through December 2022 showed the following Group Life mortality results: • Estimated reported Group Life claim incidence rates were up 15.9% on a seasonally adjusted basis compared to 2017–2019 reported claims. (Whoa - On average, 15% more Americans are continuing to die monthly compared to before the pandemic).
Now, here are the charts and points that my colleague highlighted in an email as the most interesting (the last one is the most compelling). From their email:
1. The SOA data shows modest death increase in 2020 during COVID, big increases in mortality only in dec 2020 (vaccine rollout), vaccine mandates (fall 2021) and the booster campaign (winter 2021/2022).

2a. White-collar workers saw the biggest increases in all cause mortality in 2021 and it has continued to be elevated relative to blue or gray collars (grey collars are “hybrid” e.g. educated blue collar like teachers, nurses and supervisors).

So, why were white collar workers suddenly dying at a historically unprecedented rate in the 3rd and 4th quarters of 2021? What happened at that time in the white collar workplace? Does the SOA think they all got drafted to fight on the front lines in Ukraine?
2b. This higher excess mortality was greatest in government jobs...

Per footnote, this isn't police and fire, but other types of government employees. I don't know for sure but suspect Misc Services/Data Processing or maybe Tech sector and Auto/Airplanes/heavy government contractors.
Does anyone remember a federal mandate for government employees and its contractors to get the Covid jab in the Fall of 2021?

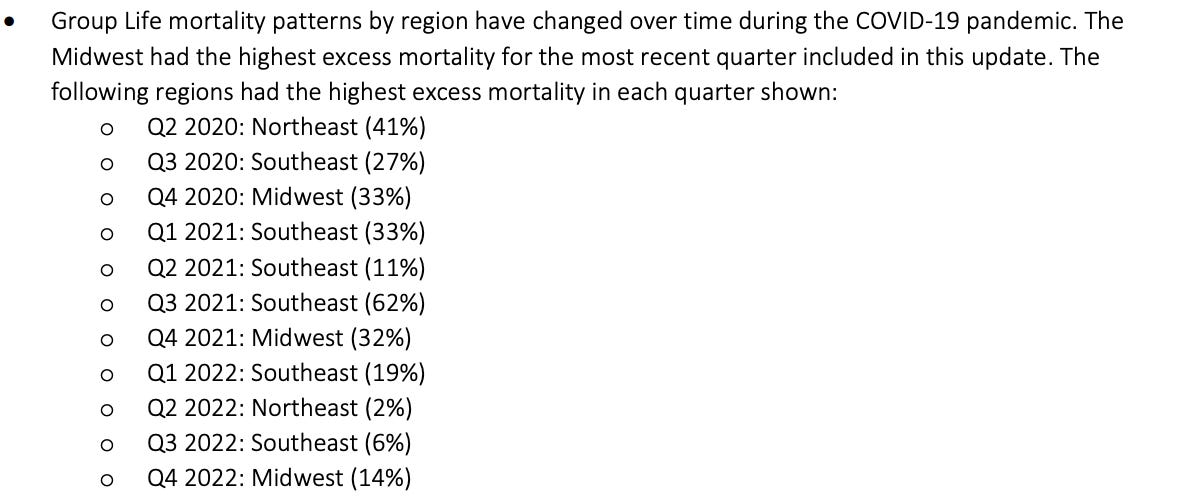
3. Just to include it, it is important to note the concentration of 3Q'21 in the Southeast.

Could be Vax driven, e.g. fall 2021 mandates, could be bad doses to some states, could also be differential health status by region (south sickest/heaviest), could also be differential in remdesivir/ventilator/PCR/other denial of care protocols across different states, and all of these things amplifying each other.
Me - I am not sure what to make of the regional differences above except to say that in the report, the SOA found that the regions with highest excess mortality varied over time as follows:
4a. This is the age excess mortality chart - shows old people are fine, and young people still have excess mortality as of the 4th Quarter of 2022:
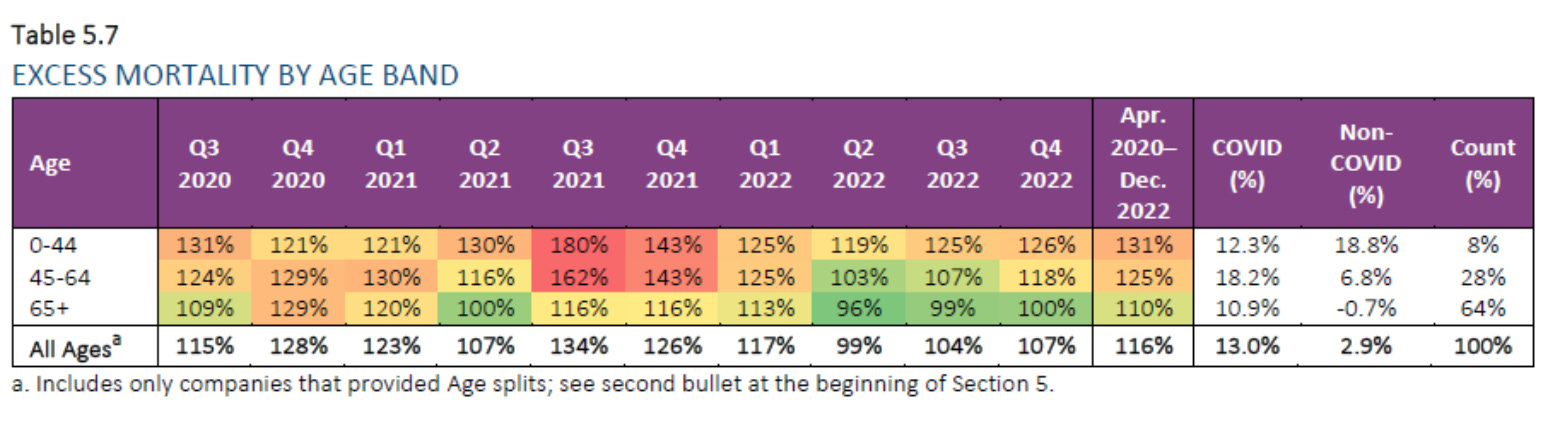
Again the data is screaming for 3rd quarter 2021 with a sudden 180% increase in death claims for the youngest and healthiest members of society (i.e ages 0-44)? Did the opioid epidemic, global warming, or lockdowns occur just before or during that quarter? Umm.. no.
This is probably the key focus for your op-ed. Why are youthful folks ages < 64 still suffering worse excess mortality?
Although I too was troubled to see the excess mortality continuing through 4th quarter 2022,, I still cannot avert my eyes away from the flashing red death signals in the 3rd and 4th quarters of 2021. Do you think this might correlate with the massive explosion in newspaper reports of young people “dying suddenly?”

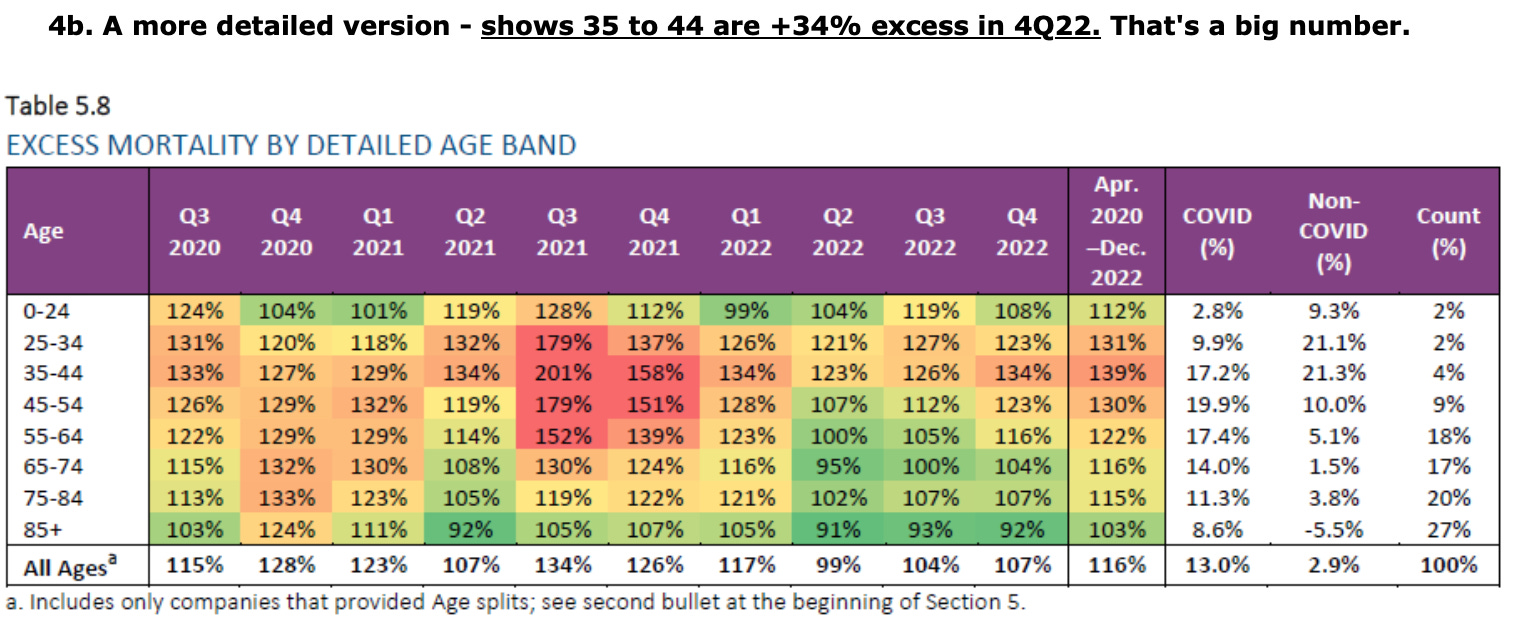
In the previous chart (5.8) to this one above, the 35-44 year olds have an excess mortality in the 4th quarter 2022 which is increased 39% over baseline yet the Covid deaths at that time were only up 1%.
5. Note that they identified that they had worse excess mortality than the U.S. from 4Q'20 to 1Q'22 but before and after it was better.
Probably this is due to differential adoption of the vaccines for employed folks vs unemployed and not-in-labor market folks.
Note that Injured folks who leave their job (from injury), and then die afterwards, don't show up as deaths for these policies since there is no coverage for former employees. Possibly some on company disability or workers compensation leave would be covered, but generally former employees lose group life coverage when they leave a company's employment.
Whoa - this means that the data in the SOA report, as disturbing as it is, is also an underestimate.
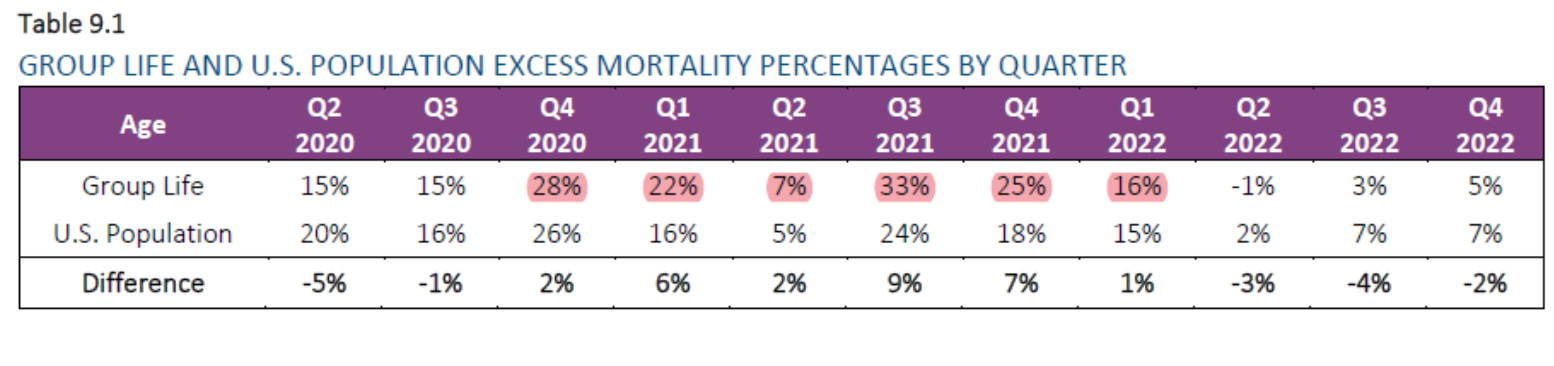
In regards to the chart above, a point that analyst Ed Dowd often makes is that Group Life insurance holders have traditionally been the healthiest members of society with the lowest mortality rates as a sector. Yet, from the jab rollout until the 2nd quarter of 2022, that sector of society began dying at a much higher increased rate then the general U.S population. Recall that group life insurance is also described as a “work perk.” So, American workers began dying at increased rates compared to non-working Americans. Again, what happened in the American workplace over this time period?
7. The differential varies by age; old folks who are still working have less excess mortality than other retired folks, but younger age group life populations see worse mortality than peers who are not in group life (e.g. not employed, or not in labor force).

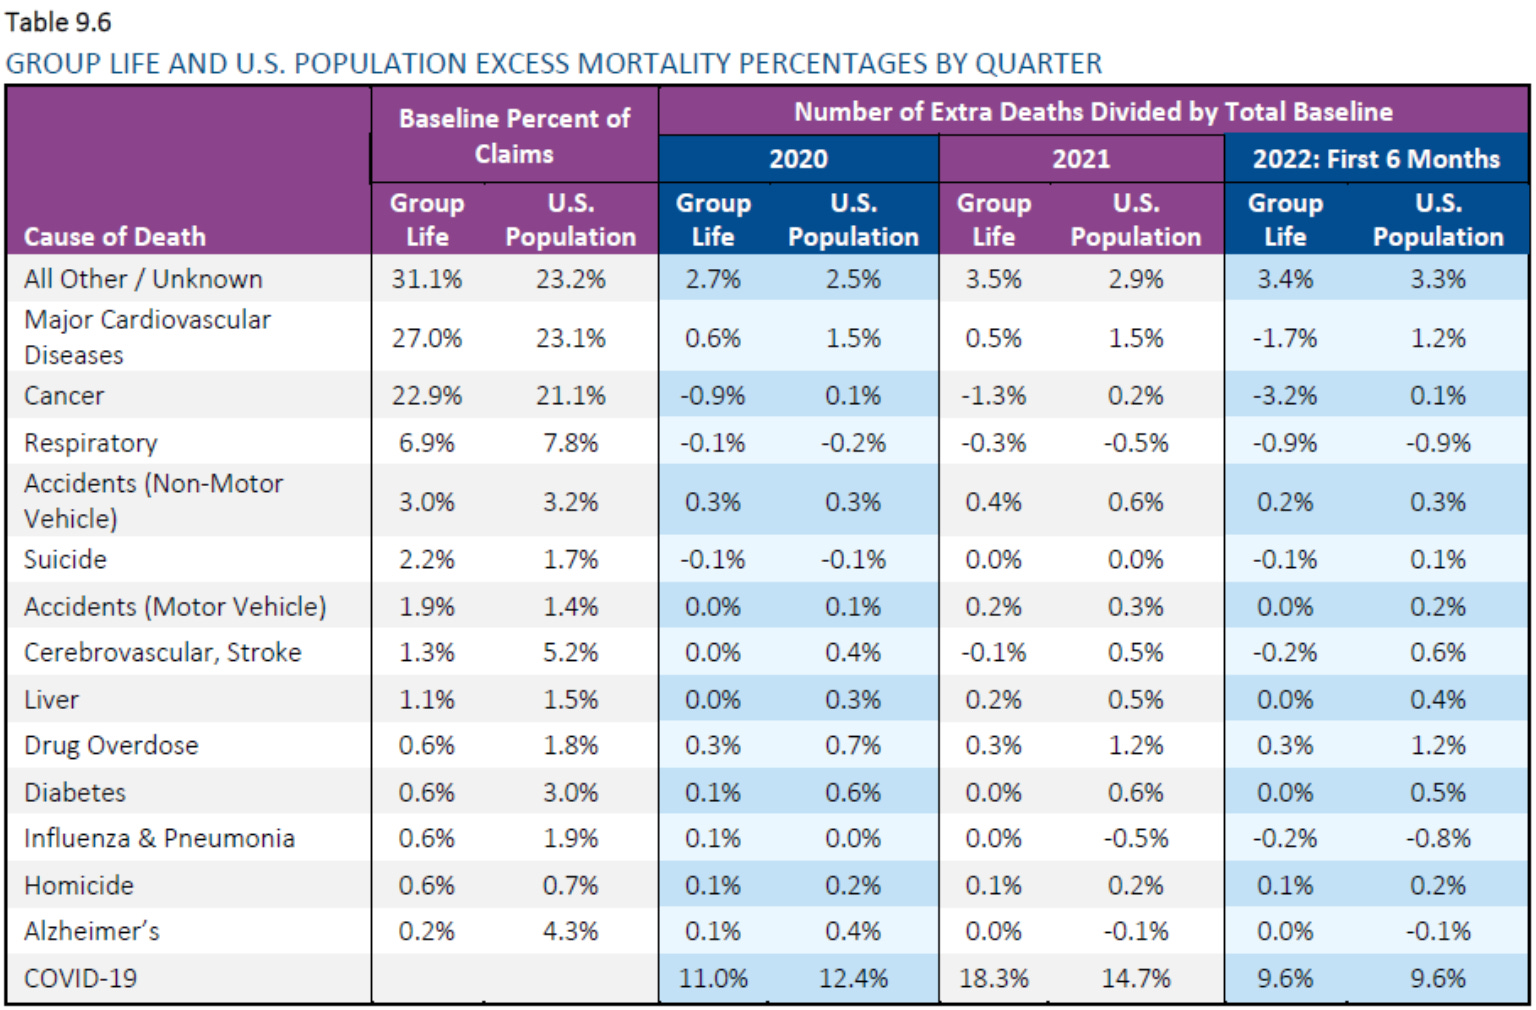
8. This is a good table that shows what's driving claims - In U.S. population it is cardiovascular, drug overdoses, accidents, stroke, liver problems (offsetting decline in COVID 19) plus "all other/unknown."
9a Correlations: This is what they are referencing in their quote (steep slope and R2 0.349)
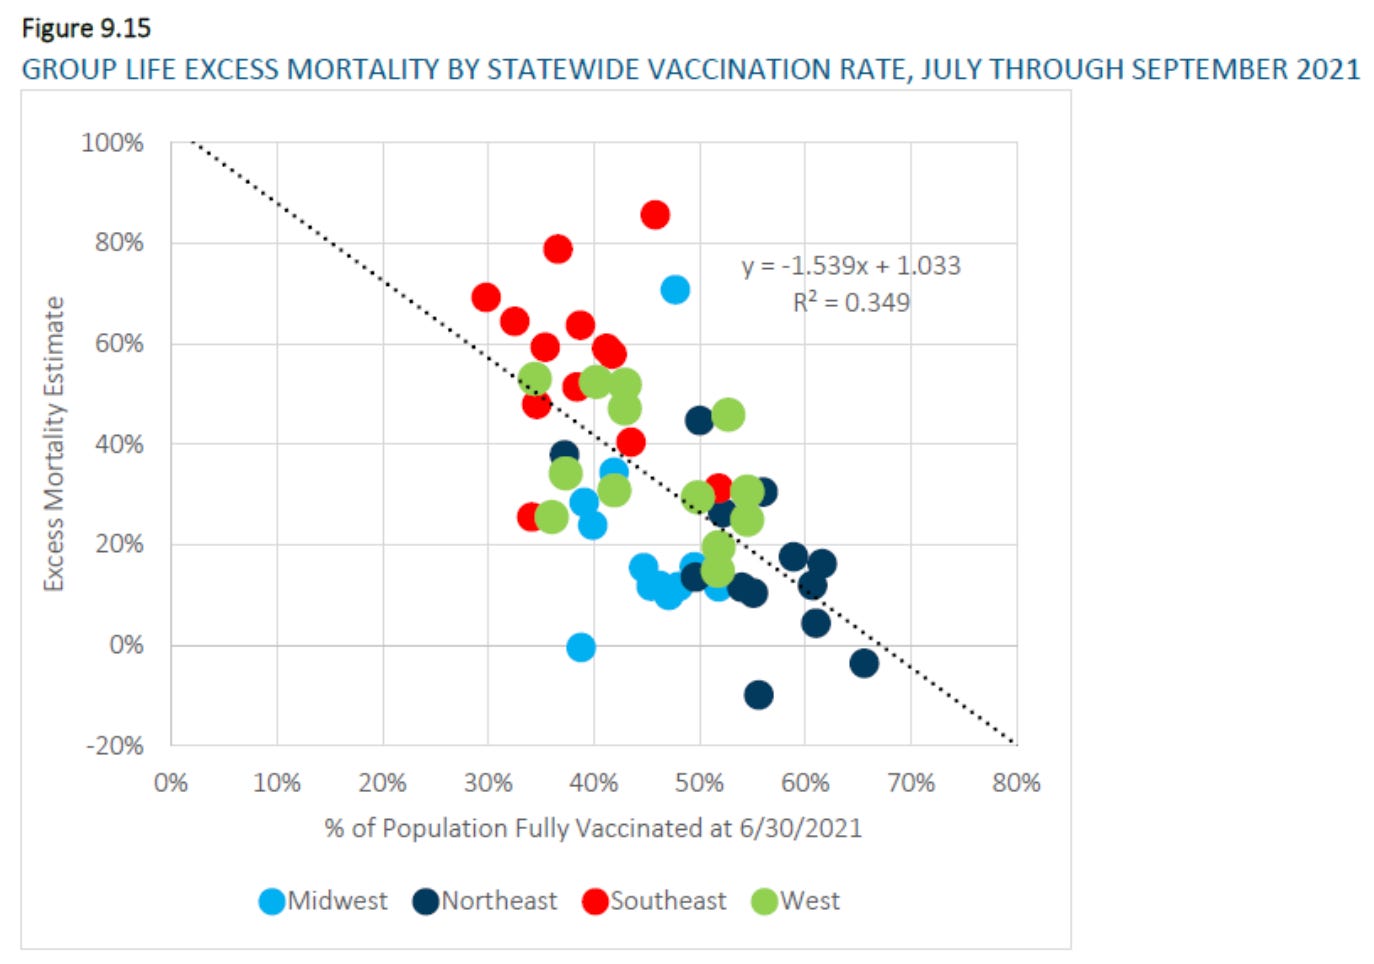
Data in July - Sept 2021 is strong favorable (though just as easily could be due to remdesivir mortality + PCR fraud + higher level of obesity/COVID comorbidities in low vax states). This is what they previously had concluded as proof of efficacy as many others have, too.
Why show a chart focusing on that relationship for only a three month period? What happened with this data over time? Let’s see…
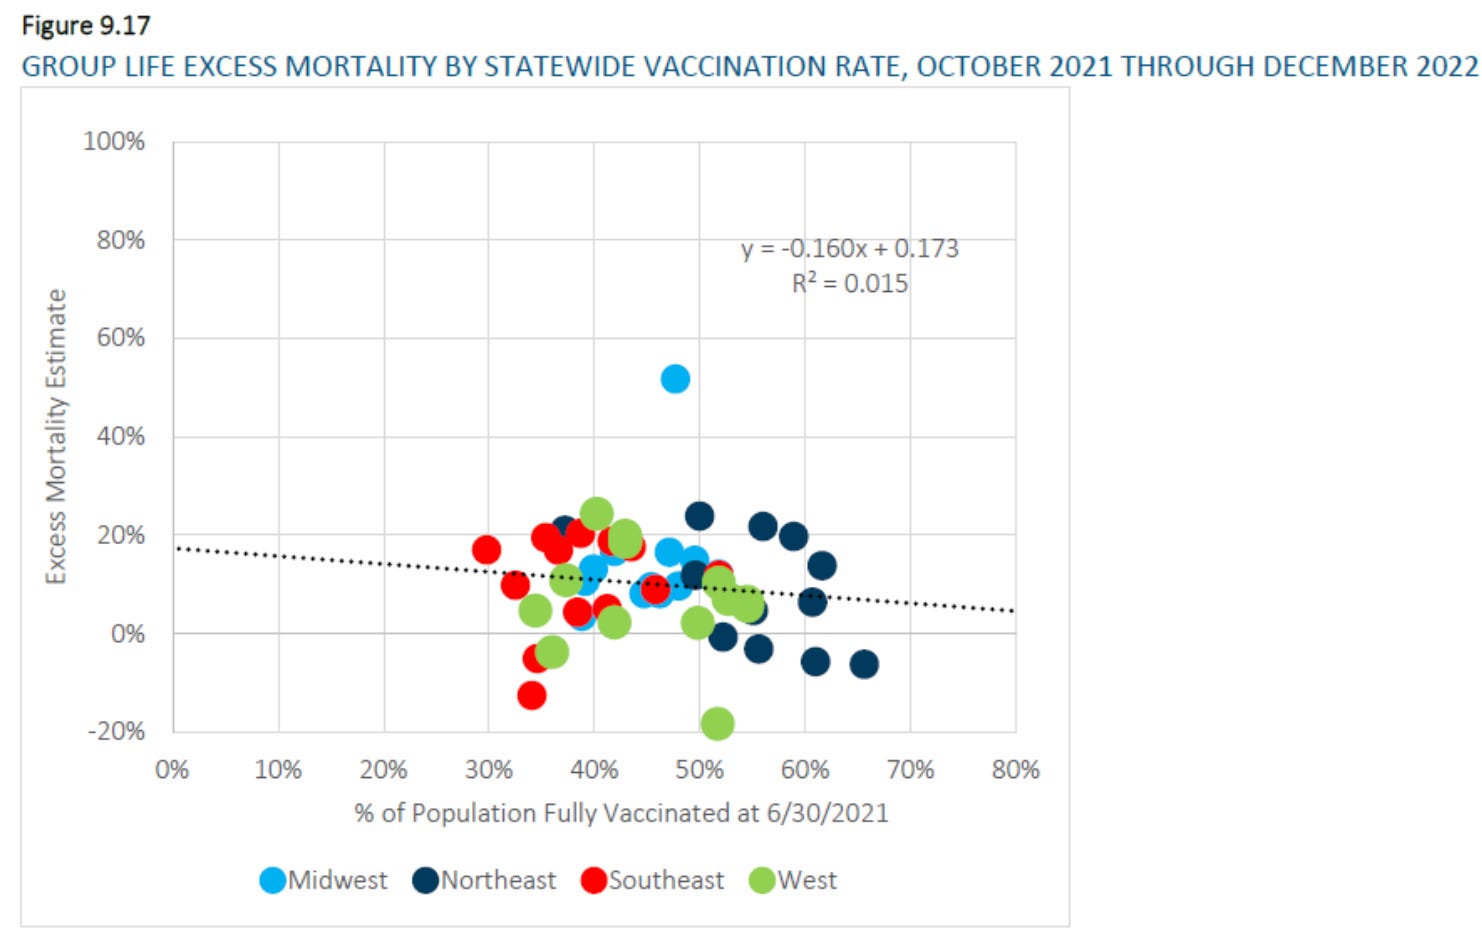
9b. But then Oct 21 thru Dec 22 relationship disappears (slope is flat, and R2 is 0.015)
There is basically ZERO relationship if you use the same X axis, e.g. ranking states by Vax level as of 6/30/2021. (not correct, but what they did).
9c. And if you update the X axis to include % of population that is fully vax'd plus % a single additional dose you now have an anti-vax chart - e.g. line is going the wrong way... e.g. more doses, more death (but low R2 of 0.029)

9d. THEY DIDN'T DO A CHART THAT ADJUSTS FOR DOSES TAKEN IN 2022 (BOOSTERS OR CONTINUED PRIMARY DOSES). THIS IS SUSPICIOUS IN ITS ABSENCE.
Including 2022 activity would have FURTHER STEEPENED THE LINE (e.g. as most vax friendly states see many people get shot #4 or #5 (and some laggards add #1,#2, #3) through 2022). This data is available and it is surprising they didn't use it, maybe they did and didn't like how it looks.
My cynicism at this point knows no bounds and so I think the insurance expert is onto something here. The SOA presenting only these data is a form of “cherry-picking” which has been a consistent tactic by authorities when marshaling scientific support for the pro-vax, anti-ivermectin and anti-hydroxychloroquine campaigns.
Of course, the r2 is low and there can certainly be confounding factors, but figure 9.21 is their chart, and their data shows that more vaxed' states have higher excess mortality in 2022.
This is a fact - in their report - which is opposite of their stated conclusions that vax contributed favorably. Their data shows that in 2022 it was actually a negative.
In summary:
1) Their data shows that younger people and people who were working suddenly had worse mortality in ‘21 and ‘22, and was concentrated in some professions, including the government employees.
2) Their data shows that as of year end 2022, excess mortality continues, even though COVID was no longer a major driver of mortality, instead driven by other/unknown causes and a few others (see 8).
3) Their data shows that any benefits to the vax in early 2021 were no longer helpful, and was harmful in 2022 (though confounding can't be ruled out and r2 is low).
I'm happy to discuss if can be helpful. For sure there are a lot of ways to interpret all of this data, but I don’t think I am stretching with anything I say above, as long as it includes appropriate caveats.
-Anonymous
Ultimately, although to me the signals of vaccine lethality are screaming from the report, the SOA does not have data on the individual vaccination status of the young workers that suddenly started dying at historically unprecedented rates. Instead they were forced to rely on comparing differences in state vaccination coverage rates and their respective excess mortalities to conclude anything with statistical significance (I should give them credit for at least attempting to do this analysis).
Thus, it is correct that they cannot definitively conclude the vaccines as a cause of excess mortality from their data. One caveat to add to that is.. how accurate are the state vaccination coverage rates? The incentives to over-report vaccine uptake were not insignificant. This should also be taken into account.
Unsurprisingly, and probably appropriately, the SOA does not attempt to interpret or even specifically mention the timing, suddenness, and magnitude of the rises in death claims of young, white collar workers. I would agree that it is not their job to do this, so the rest of us will. Again, simply by asking if there were any other events preceding and during those massive spikes that could explain the rises. I can find no other rational explanation than the roll-out of vaccine mandates as the cause.
However, the SOA’s multiple statements against finding a correlation of excess mortality with the vaccines, although appropriately cautious, seems to stem from a strong desire to not be drawn into any debates regarding their lethality. The SOA’s unsurprising cowardice is why we wrote the Op-Ed in the only way we could (i.e. not even mentioning the vaccines as a possible or probable cause).
P.S I just want to say thanks to all my subscribers, especially the paid ones! Your support is greatly appreciated as it allows me to devote what is often large amount of time I spend researching and writing my posts, so again, thanks. - Pierre
https://pierrekory.substack.com/p/the-may-2023-society-of-actuaries